Figure 1.
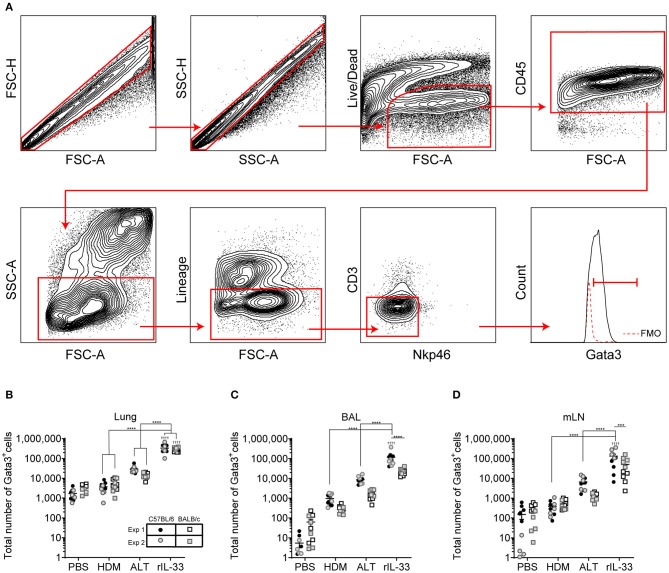
Group 2 innate cells increase in response to allergen and rIL-33. (A) Gating Schematic. ILC2s are defined as Single, Live, CD45+, Lymphoid, Lineageneg (TCRβ, TCRγδ, CD3e, CD5, CD19, CD11b, CD11c, FCεR1, GR-1, F4/80, and TER-119 negative), CD3−, Nkp46−, Gata3+. (B) Total number of Gata3+ cells in the Lineageneg CD3−, NKp46− population in the lung. (C) BAL and (D) Mediastinal lymph node (mLn). Data is the combination of two individual experiments, n = 10 per group. ††††P < 0.0001 compared to PBS control. ***P < 0.001, ****P < 0.0001 comparing between strains or treatment groups.

