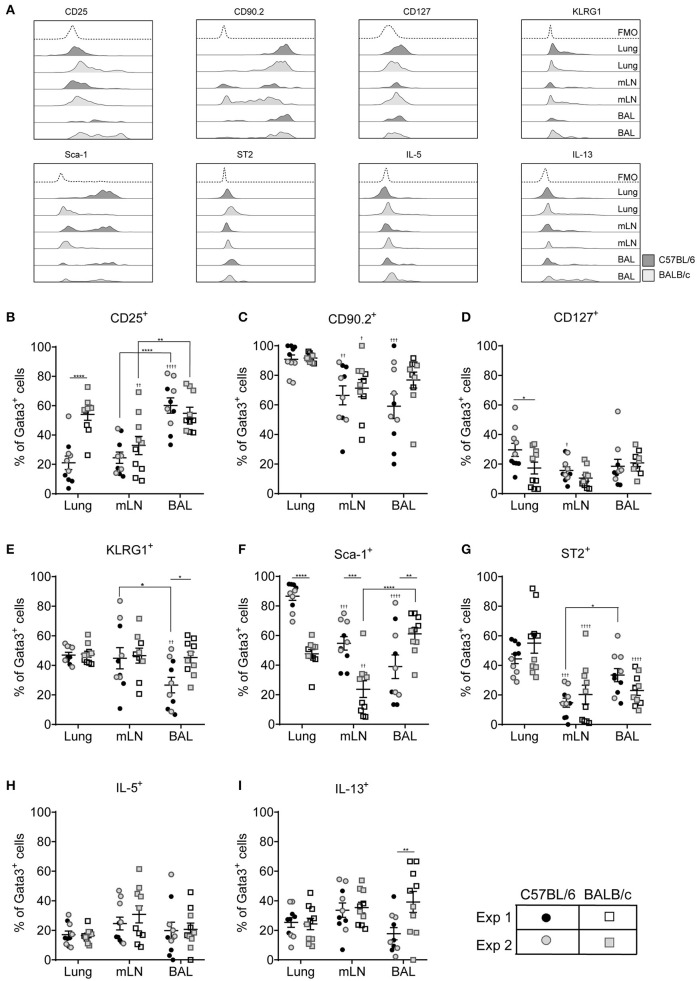
Figure 4.
ILC2 marker expression varies between pulmonary locations. (A) Representative histograms for extracellular and intracellular markers on Gata3+ cells taken from BAL, lung or mLN in C57BL/6 and BALB/c mice. Percentage of Gata3+ cells expressing (B) CD25, (C) CD90, (D) CD127, (E) KLRG1, (F) SCA1, (G) ST2, (H) IL-5, and (I) IL-13. Data is the combination of two individual experiments, n = 10 per group. †P < 0.05, ††P < 0.01, †††P < 0.001, ††††P < 0.0001 compared to lung. *P < 0.05, **P < 0.01, ***P < 0.001, ****P < 0.0001 comparing between strains or lung compartment.

