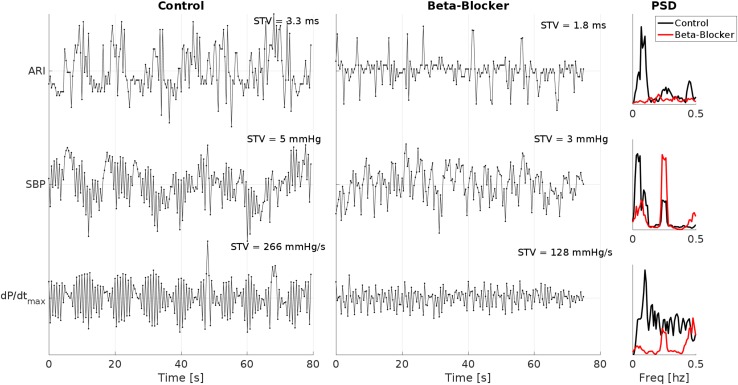
FIGURE 2.
Example ARI, SBP and dP/dtmax time series of one patient breathing at 15 breaths/min (0.25 Hz) during control and following beta-adrenergic blockade. Clear low-frequency oscillations are visible in all traces during control, which are attenuated following beta-adrenergic blockade. Also note the reduction in the short time variability (STV) measures. PSD, power spectral density.

