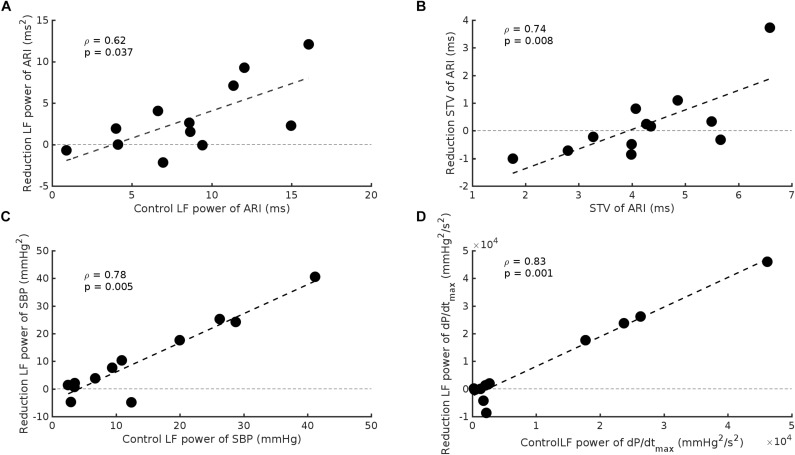
FIGURE 5.
Scatterplots demonstrating the significant relationship between baseline values and the reduction seen following beta-adrenergic blockade in: (A) LF power of ARI, (B) beat-to-beat variability of ARI (STV ARI), (C) LF power of systolic blood pressure (SBP), and (D) the LF power of the maximum rate of systolic pressure increase (dP/dtmax).

