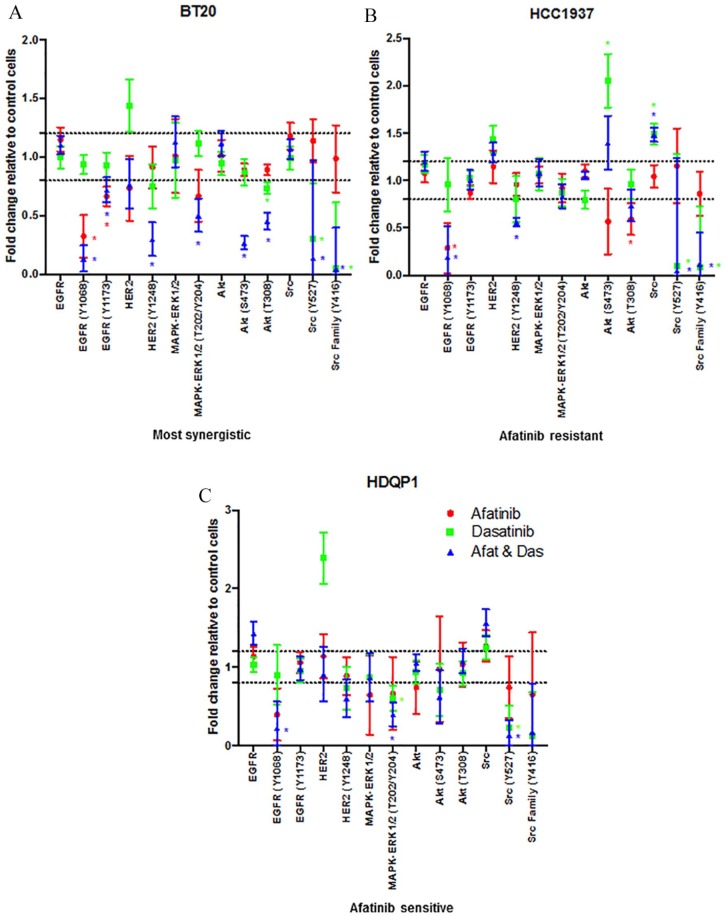
Figure 3.
Effect of afatinib and dasatinib, alone and in combination, on cell signalling proteins. (A) BT20, (B) HCC1937 and (C) HDQP1 cells were treated with afatinib (1 μM), dasatinib (200 nM), dasatinib or the combination (5:1) for 24 h. Total protein and phosphorylated protein levels were determined by RPPA. Results displayed as fold-change relative to control treated cells. SEM calculated from three independent protein samples. ‘*’ indicates proteins that have a fold-change of ⩾1.2 fold and a p value of < 0.05 as determined by Student’s t test.

