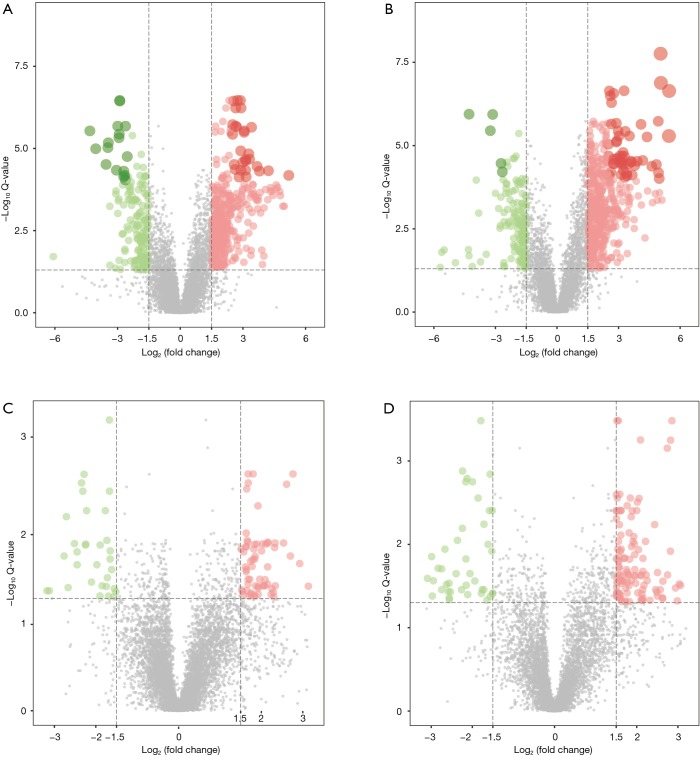
Figure 4.
Identification of metabolic signatures in the control and AS groups (Q<0.05). The red point indicates upregulation, and the green point indicates downregulation. (A) A heatmap plot was drawn to show the differential positive-ion metabolites in control samples versus model samples. (B) A heatmap plot was drawn to show the differential negative-ion metabolites in the control samples versus the model samples. (C) A heatmap plot was drawn to show the differential positive-ion metabolites in the quercetin samples versus the model samples. (D) A heatmap plot was drawn to show the differential negative-ion metabolites in the quercetin samples versus the model samples.

