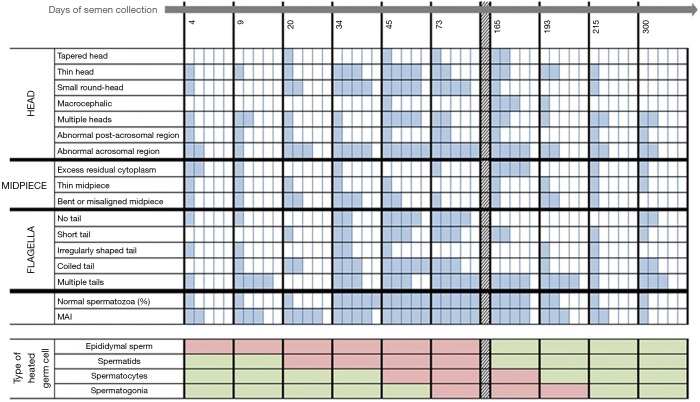
Figure 4.
Diagram to illustrate the number of volunteers with a higher percentage of abnormalities during and after mild induced testicular and epididymal heating than at baseline before heating (see results) and which correspond to the spermatogenesis stage and epididymal transit heating chronology. Each cell represents one volunteer. For one anomaly, a blue cell means that a volunteer has an abnormal percentage. A white cell means that a volunteer has a normal percentage. A green cell means that the stages of spermatogenesis or epididymis were not heated. A red cell means that the stages of spermatogenesis or epididymis were heated.

