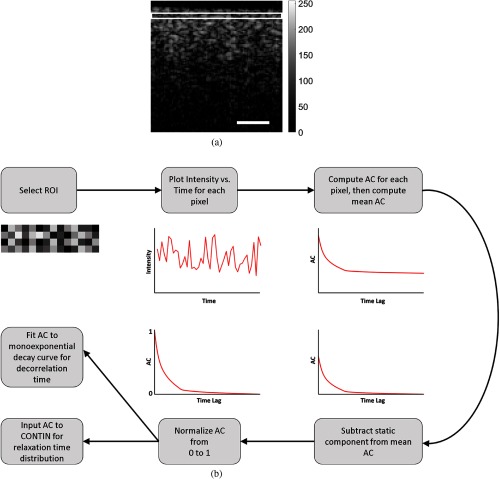
Fig. 1.
(a) OCT -mode image of an MCF-7 cell pellet. The ROI is indicated by the white rectangle. The color bar indicates pixel image intensity between 0 and 255. The scale bar represents 0.25 mm. (b) Diagram depicting the postprocessing pipeline used in this study to acquire DT and relaxation time distribution from an ROI.

