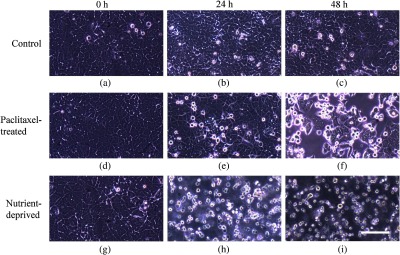
Fig. 2.

Bright-field microscopy images of control cells at (a) 0 h, (b) 24 h, and (c) 48 h; paclitaxel-treated cells at (d) 0 h (pretreatment), (e) 24 h, and (f) 48 h; nutrient-deprived cells at (g) 0 h (pretreatment), (h) 24 h, and (i) 48 h. The scale bar represents 0.2 mm.
