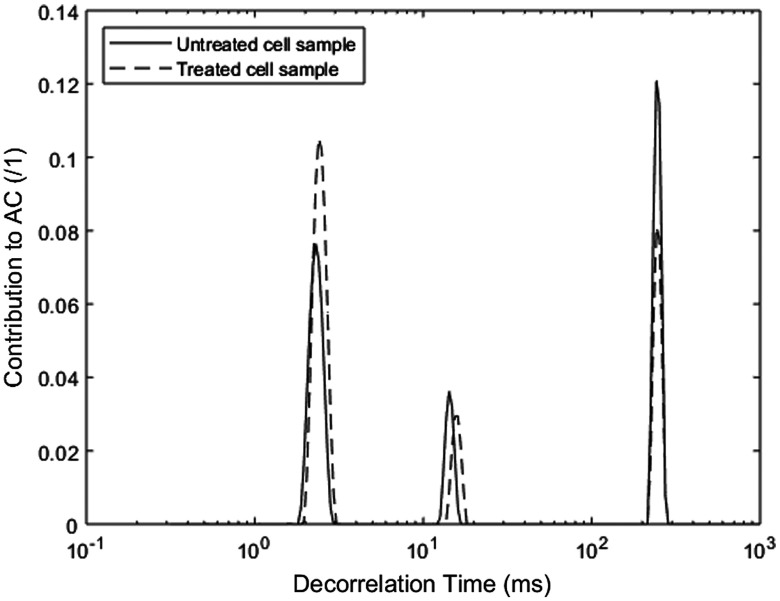
Fig. 5.
Sample CONTIN outputs depicting the contribution of various exponential decay functions to the AC as a function of their DTs. The solid line depicts a representative sample CONTIN output from an untreated cell sample while the dashed line depicts a representative sample CONTIN output from 48-h nutrient-deprived cells.

