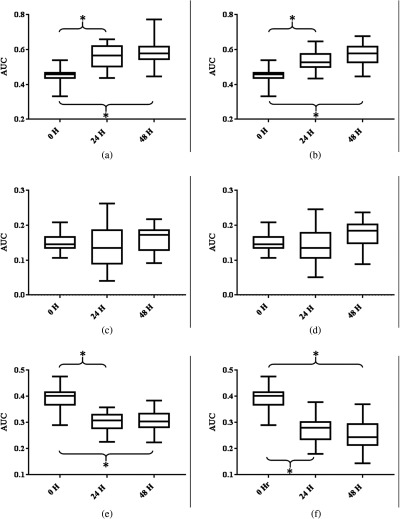
Fig. 6.
AUC of P1 in (a) nutrient-deprived cells and (b) paclitaxel-treated cells as a function of treatment. AUC of P2 in (c) nutrient-deprived cells and (d) paclitaxel-treated cells as a function of treatment. AUC of P3 in (e) nutrient-deprived cells and (f) paclitaxel-treated cells as a function of treatment. Box plot whiskers show the minimum and maximum values in each group. The central line within the box plots is the group median. The top and bottom limits of the boxes are the 75th and 25th percentiles, respectively. Each box represents a group of 30 measurements. No outliers were detected. *.

