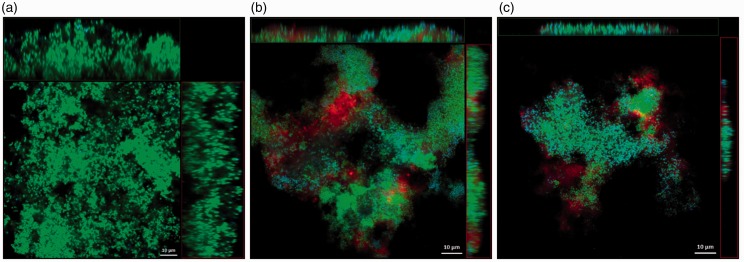
Figure 3.
Confocal laser scanning microscopy images of S. aureus biofilms before CPC-quatsome treatment (a), after 0.05% CPC-quatsome treatment for 5 min (b), and after 0.05% CPC-quatsome treatment for 2 h (c). Quatsomes were stained red (DiI), live S. aureus green (SYTO-9), and dead S. aureus blue (SYTOX). The large center images showed the X-Y view of the central layer from the z-stack; the top bars showed the X-Z view of the central layer from the y-stack, the vertical bars to the right showed the Y-Z view of the central layer from the x-stack for the same biofilm. (A color version of this figure is available in the online journal.)

