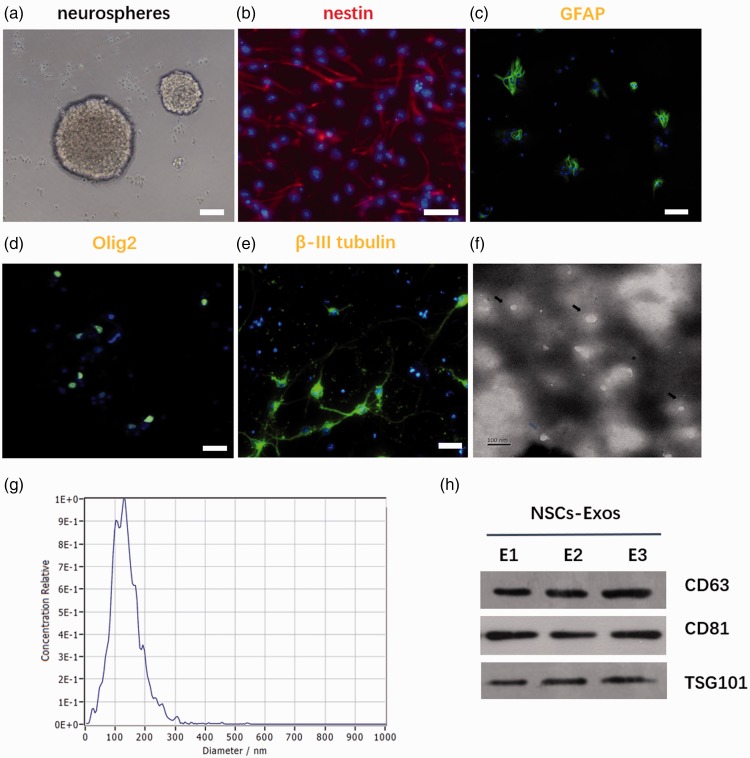
Figure 2.
Characterization of NSCs and NSCs-Exos. (a) NSCs showed spherical in shape. Scale bar: 100 μm. (b) Immunofluorescence staining of nestin in NSCs. Scale bar: 100 μm. (c–e) NSCs could differentiate into astrocytes, oligodendrocytes, and neurons under different conditions, as evidenced by GFAP (c), Olig2 (d), and β-III tubulin (e) immunofluorescence staining, respectively. Scale bar: 100 μm. (f) Representative TEM image of exosomes. Scale bar: 100 nm. (g) Size distribution of exosomes based on Malvern Zetasizer Nano ZS90 measurement. (h) Western blot for membrane proteins of NSCs-Exos. (A color version of this figure is available in the online journal.)

