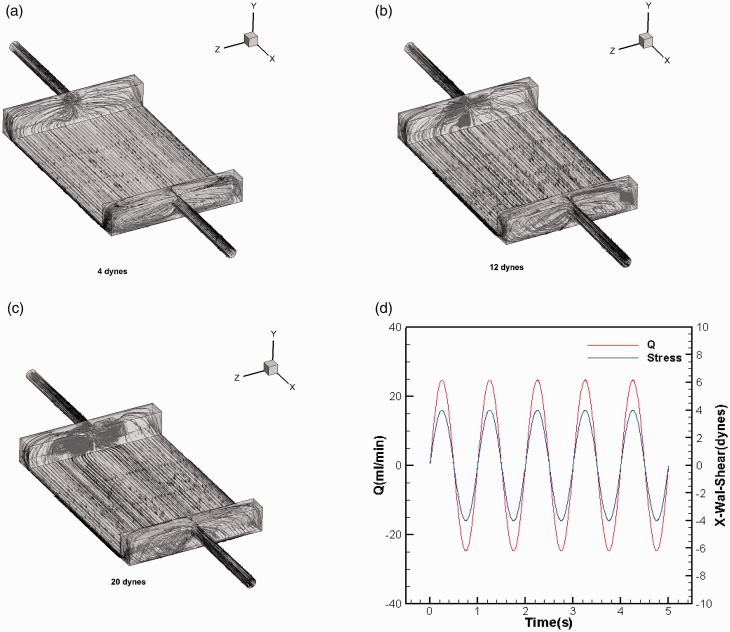
Figure 3.
(a) The image shows a streamline diagram of fluid at 25 mL/min flow rates (4 dyn/cm2). (b) The image shows a streamline diagram of fluid at 75 mL/min flow rates (12 dyn/cm2). (c) The image shows a streamline diagram of fluid at 125 mL/min flow rates (20 dyn/cm2). (d) The changing curves of velocity and wall shear stress with time under unsteady flow conditions. The sine functions with a frequency of 1 Hz and amplitudes of 4 dyn/cm2. (A color version of this figure is available in the online journal.)

