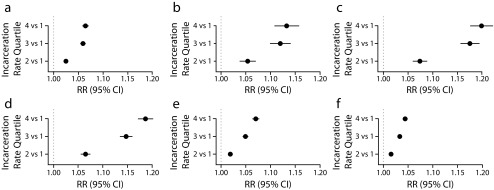
FIGURE 1—
Associations Between Quartile Change in County Jail Incarceration Rate and Change in County Mortality Rates for (a) Total and Ages (b) < 15, (c) 15–34, (d) 35–54, (e) 55–74, and (f) ≥ 75 Years: United States, 1987–2016
Note. CI = confidence interval; RR = risk ratio. Numerical findings are presented in Table B (available as a supplement to the online version of this article at http://www.ajph.org).

