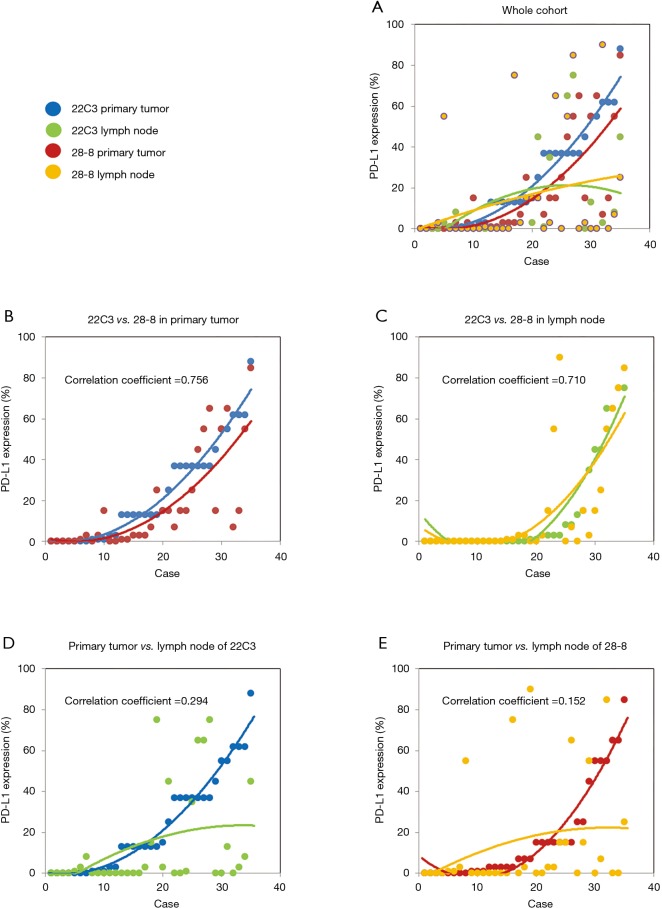
Figure 3.
The five scatter plots illustrate the distribution of PD-L1 expression. (A) Each colored dot represents PD-L1 expression; blue (primary tumors stained by 22C3), green (lymph nodes stained by 22C3), red (primary tumors stained by 28-8), and yellow (lymph nodes stained by 28-8); (B) the scatter plot illustrates PD-L1 expression distribution in primary tumors stained by either 22C3 or 28-8 antibodies; (C) the scatter plot depicts a similar correlation of PD-L1 expression in lymph nodes between the 22C3 and 28-8 assays; (D) no correlation of PD-L1 expression was demonstrated between primary tumors and lymph nodes when performing the 22C3 assay; (E) similarly, in the 28-8 assay, there was no statistical association of PD-L1 expression between primary tumors and lymph nodes.

