
Fig. 6.
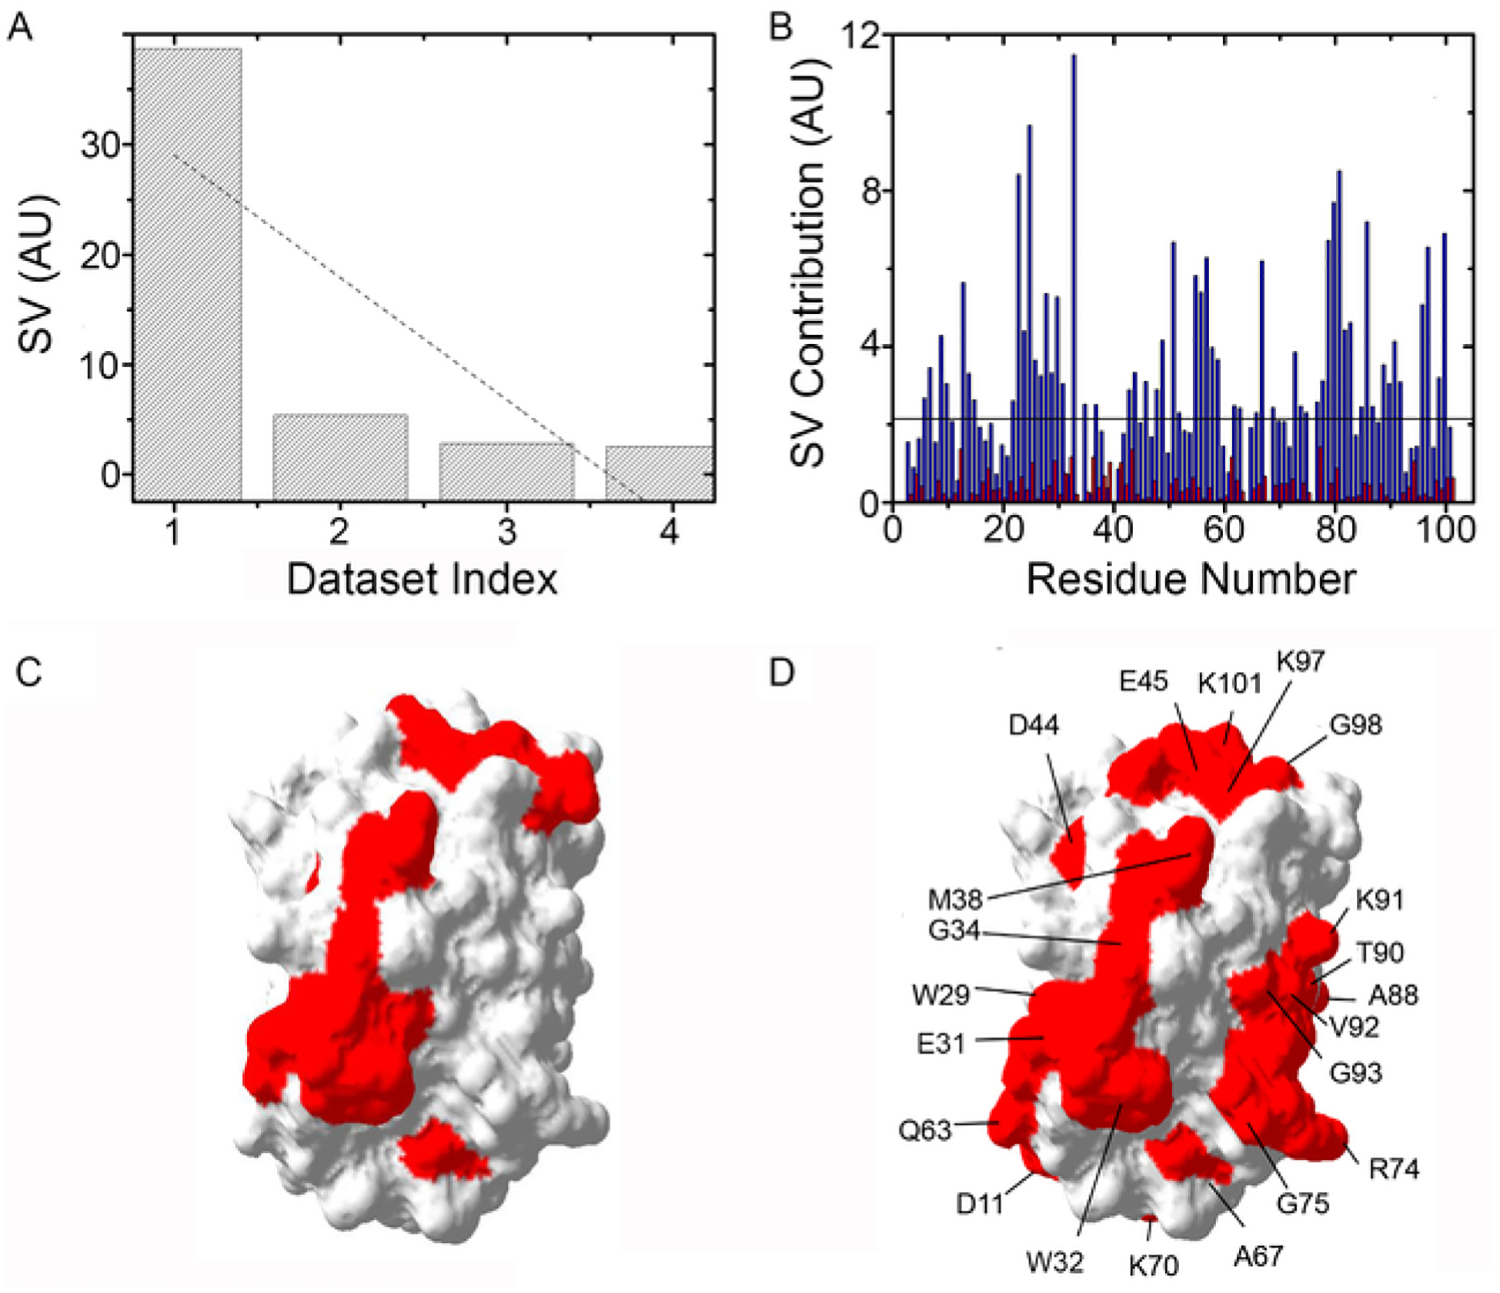
SVD analysis of Trx RT STINT NMR spectra. (A) Distribution of singular values, SV, of each data set index (binding mode) for Trx residues in the presence of streptomycin. (B) The contribution of each residue in response to adding streptomycin for the first (blue) and second (red) binding modes. (C) Surface map of Trx (Protein Data Bank entry 1X0B) showing the quinary interaction surface (red) in the absence of antibiotics. (D) Surface map of Trx showing the quinary interaction surface (red) in the presence of streptomycin. Residues that comprise the interaction surface are indicated.