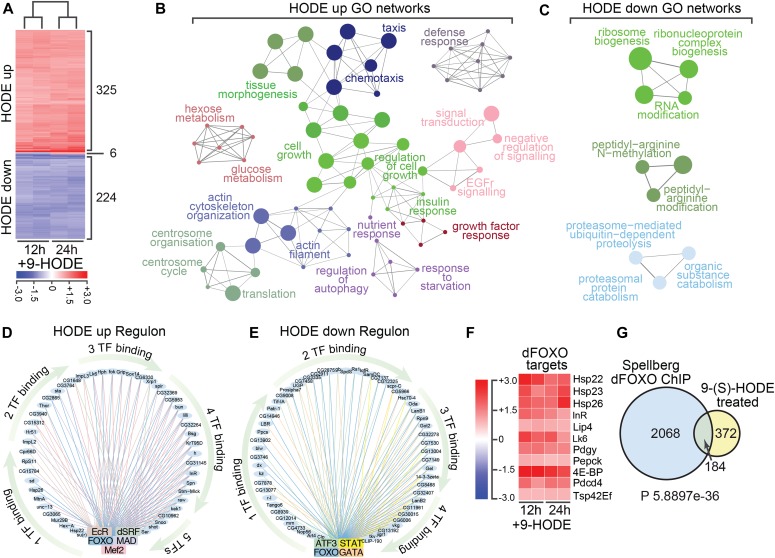
Figure 3. Transcriptome analysis reveals 9-(S)-HODE regulates dFOXO targets.
(A) Heat map showing differentially expressed genes in S2 cells 12 and 24 h after 9-(S)-HODE treatment. Scale bar indicates fold-change relative to mock-treated control. (B) Gene ontology (GO) network analysis of the 325 genes significantly up-regulated in S2 cells 24 h after 9-(S)-HODE treatment. (C) GO network analysis of the 224 genes significantly down-regulated in S2 cells 24 h after 9-(S)-HODE treatment. (D, E) iRegulon analysis of up- and down-regulated genes defines TF regulatory circuits that transduce 9-(S)-HODE signals. Binding sites for dFOXO are a common feature of both sample sets. (F) Heat map showing fold-change in transcript levels of known dFOXO target genes after 9-(S)-HODE treatment. (G) Venn diagram showing overlap between 9-(S)-HODE transcriptional targets and genes previously defined as dFOXO targets by chromatin immunoprecipitation (ChIP) on chip analysis (Spellberg dFOXO ChIP). Hypergeometric test was performed in R to determine significance of overlap.

