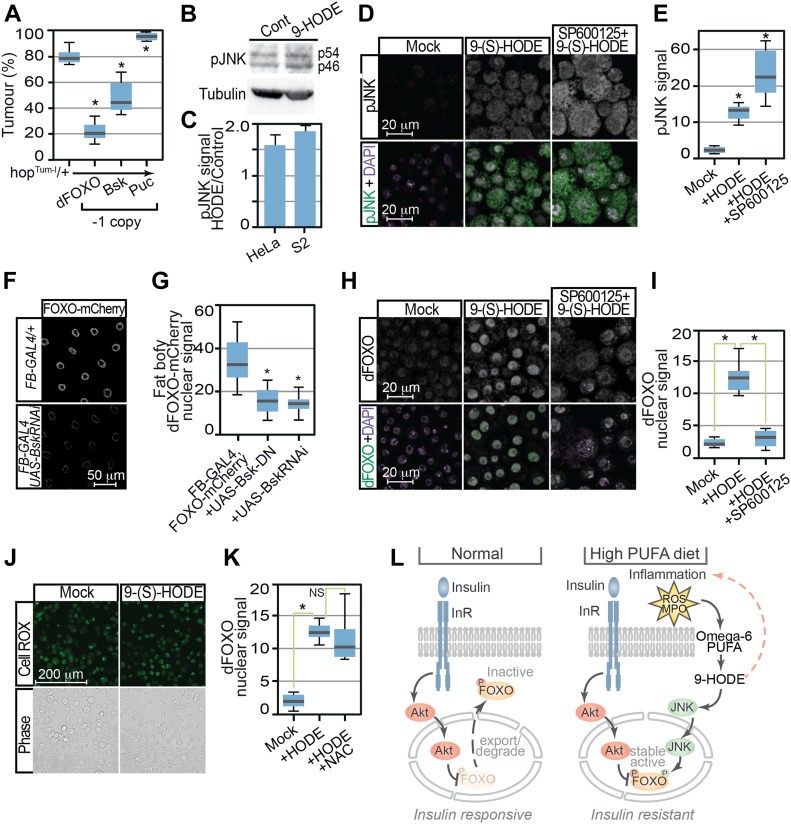
Figure 5. Control of dFOXO by 9-HODE is mediated via the JNK pathway.
(A) Tumour incidence in heterozygous hopTum females flies was decreased by reduction in dFOXO (FoxoΔ94) or Bsk (bsk1) levels but increased by removal of Puc (pucE69). (B) JNK activation was confirmed by Western analysis of human HeLa and Drosophila S2 cells 24 h after 9-(S)-HODE treatment using anti-pJNK antibodies. MAb E7 anti-tubulin is used as a loading control. Expected pJNK (p54 and p56) species in S2 extracts are indicated. (C) Quantitation of pJNK levels in 9-(S)-HODE–treated cells relative to mock-treated control. (D) Confocal immunofluorescence microscopy of mock and 9-(S)-HODE–treated S2 cells using anti-pJNK anti-dFOXO antibodies confirms JNK activation after 9-(S)-HODE treatment. (E) Quantitation of pJNK signals in S2 cells. (F) Fat body–specific over-expression of dominant-negative Bsk variants or RNAi-mediated inhibition bsk reduces 9-(S)-HODE stimulated dFOXO-mCherry nuclear entry. (G) Quantitation of dFOXO-mCherry nuclear signal in fat body tissue. (H) Pretreatment with JNK inhibitor SP600125 prevents nuclear dFOXO localisation after 9-(S)-HODE treatment. (I) Quantitation of dFOXO nuclear signal in S2 cells after treatment with 9-(S) HODE alone or with the JNK inhibitor SP600125. (J) 9-(S) HODE treatment of S2 cells does not increase reactive oxygen species as revealed by CellROX staining. (K) Reactive oxygen species are not required for 9-(S)-HODE–triggered dFOXO nuclear localisation as simultaneous treatment with N-acetyl-L-cysteine (NAC) does not prevent nuclear entry. (L) Proposed model indicating how 9-HODE activation of FOXO could confer insulin resistance. Data information: in (A), 10 replicate crosses were used for each assay point. Box and whiskers plots were generated using R. * indicates values statistically significantly different from unsupplemented, P-value < 0.001. In (E, G, I, K), 50 determinations were used for each assay point. Box and whiskers plots were generated using R. * indicates values statistically significantly different from unsupplemented, P-value < 0.001 determined using t test.

