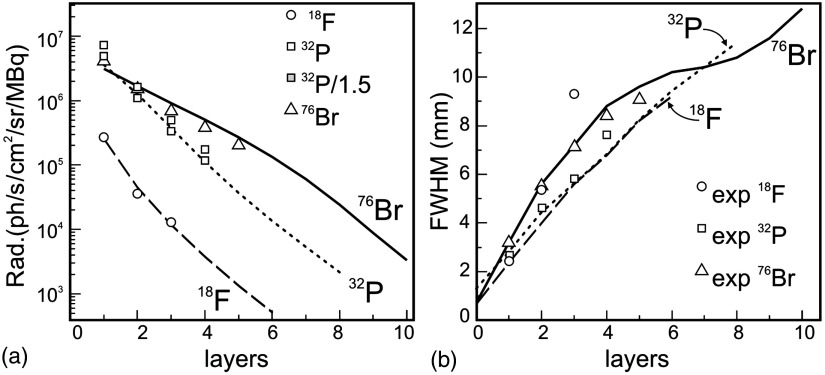
Fig. 10.
(a) Maximum radiance and (b) FWHMs as a function of the phantom thickness (layers). Lines are for MC results: dashed line is for ; dotted line is for ; and solid line is for . MC data for the radiance were fitted to the experimental data (circles). Gray rectangles are for the data scaled by 1.5. (See remark in text.)

