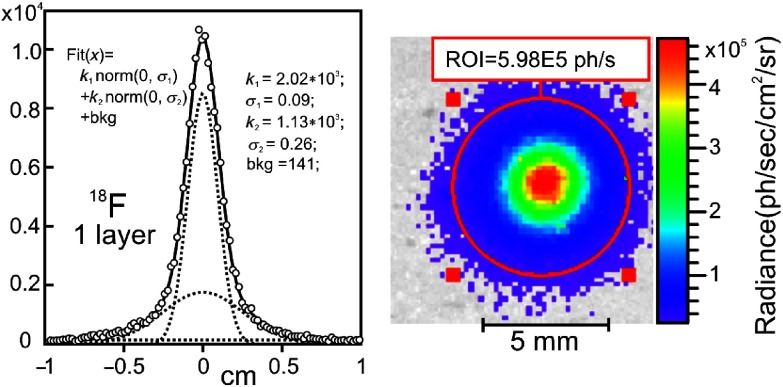
Fig. 5.
Example of the fitted radiance profile obtained from the CL image (on the right) of the one layer phantom for source. The experimental points are shown by circles. The fitted function, the sum of two normal distributions (low and high resolution), and constant background are shown by the solid line. Three components of the fitted function are shown by the dotted lines.

