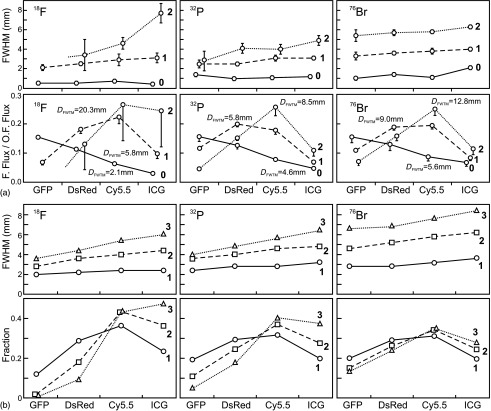
Fig. 6.
FWHM of radiance profiles and the fraction of radiation in four different spectral regions: (a) experimental data for the first two layers. Here, fraction is defined as the ratio of filtered total flux to the total flux obtained with open filter. Flux is a radiance integrated over the region of interest with diameter equals to the full width at 0.1 of maximum (FWTM) of the source CLI with open filter. (b) MC simulation for the first three layers (the fraction is calculated for the whole region). Experimental data for “0” layer are shown in (a) for reference. The filtered images of the three-layer phantom in the experimental data is too dim for quantitative analysis.

