
Figure 3.
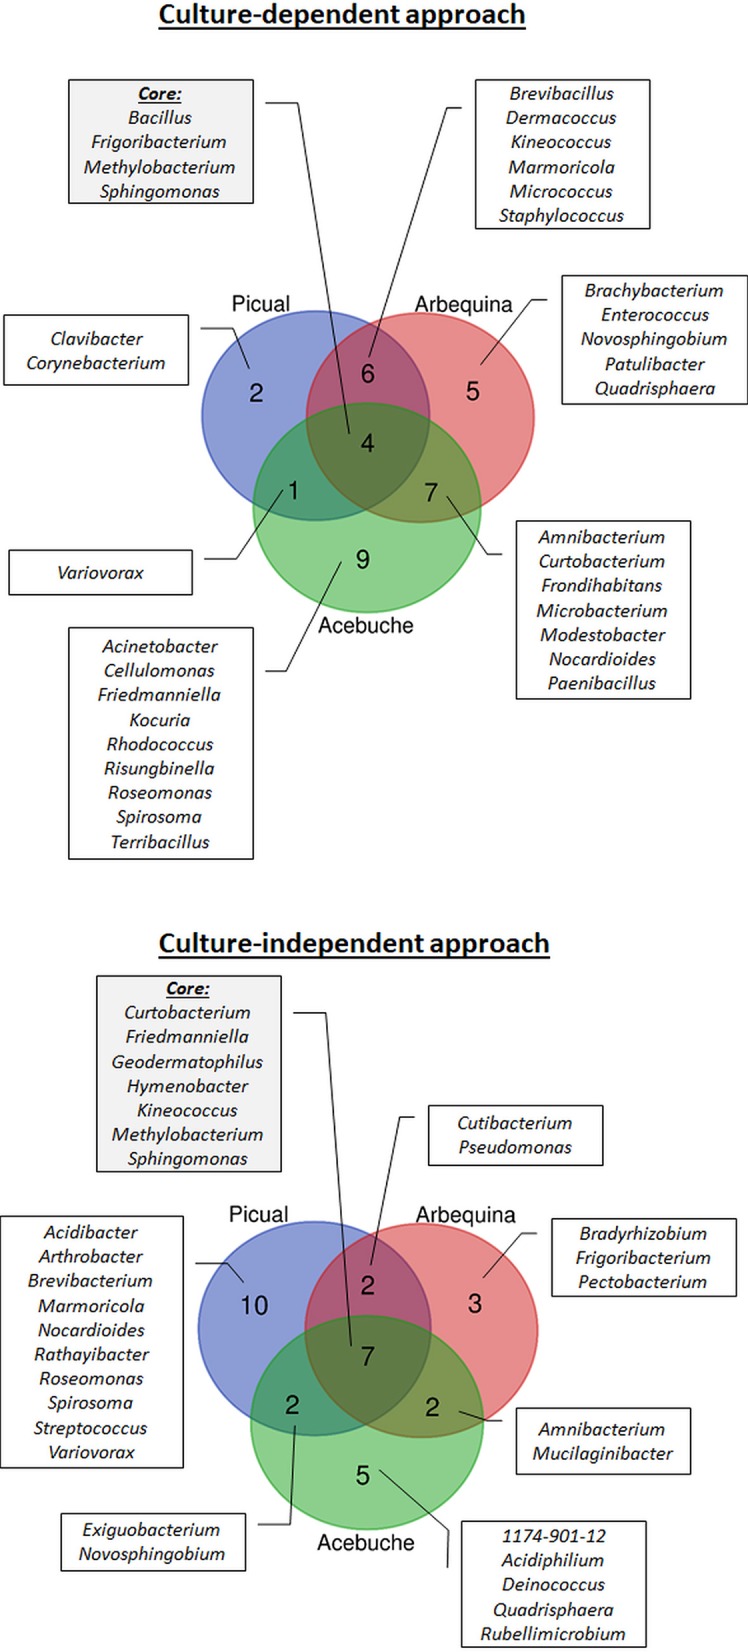
Prevalence Venn diagram showing the unique and shared bacterial genera obtained using culture-dependent approaches (upper panel) or culture-independent approach (lower panel) in olive xylem sap samples when compared by olive genotype (“Acebuche,” “Arbequina,” and “Picual”).