
Figure 1.
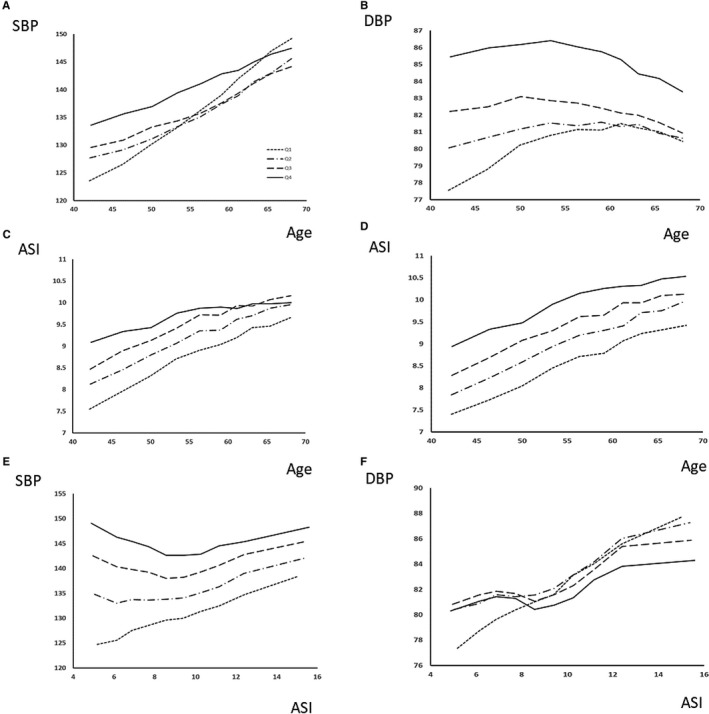
Interactions between age, blood pressure, and arterial stiffness index (ASI) at baseline. Values of mean systolic blood pressure (SBP) and diastolic blood pressure (DBP), pulse pressure (PP), and ASI are shown by deciles of age (A through D) or ASI (E and F), stratified by quartiles of ASI (A+B), SBP (C), DBP (D), or age (E+F).