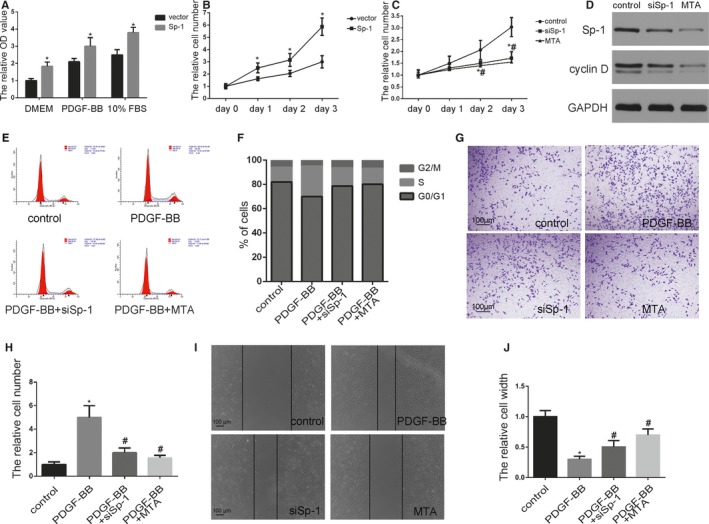
Figure 2.

Sp‐1 (specificity protein 1) promoted smooth muscle cell (SMC) proliferation and migration. A, SMCs were transfected with Sp‐1 plasmid which expressed a high level of Sp‐1. Proliferation of SMCs was measured in a variety of cell culture media using 4‐5‐dimethyl‐2‐thiazolyl‐2‐5‐diphenyl‐2H‐tetrazolium bromide assay as indicated. *P<0.05 vs vector group (n=3). B and C, Plasmid Sp‐1 (B), siSp‐1 transfected SMCs (C), or SMC treated by Mithramycin A (MTA) (10 nmol/L) were plated at equal density in 10% fetal bovine serum (FBS) medium and cells were then counted at each time point as indicated. *P<0.05 Sp‐1 or siSp‐1 vs control group (n=3). # P<0.05 MTA treatment vs control group (n=3). D, SMCs were transfected siSp‐1 or treated by MTA. Expression of Sp‐1 and cyclin D were analyzed by Western blotting. E and F, Cell cycle was measured by flow cytometric DNA analysis. The percentage of cells within the sub‐G0/G1, S, and G2/M phases of the cell cycle was determined (S phase control: 12±2%, PDGF‐BB: 25±6%, PDGF‐BB+siSp‐1: 15±2.3%, PDGF‐BB+MTA: 13±2.6%, P<0.05 PDGF‐BB vs control group. n=3). PDGF‐BB induced Sp‐1 upregulation resulted in an increase of the percentage of cells in the S phase. In contrast, siSp‐1 and MTA treatment significantly blocked cell cycle progression. G and H, Cellular invasion ability was analyzed by transwell assay. *P<0.05 vs control group (n=3). # P<0.05 vs PDGF‐BB‐treated group (n=3). I and J, Cellular migration ability was analyzed by cell scratch assay. *P<0.05 vs control group (n=3). # P<0.05 vs PDGF‐BB‐treated group (n=3). OD indicates optical density; PDGF‐BB, platelet‐derived growth factor BB.
