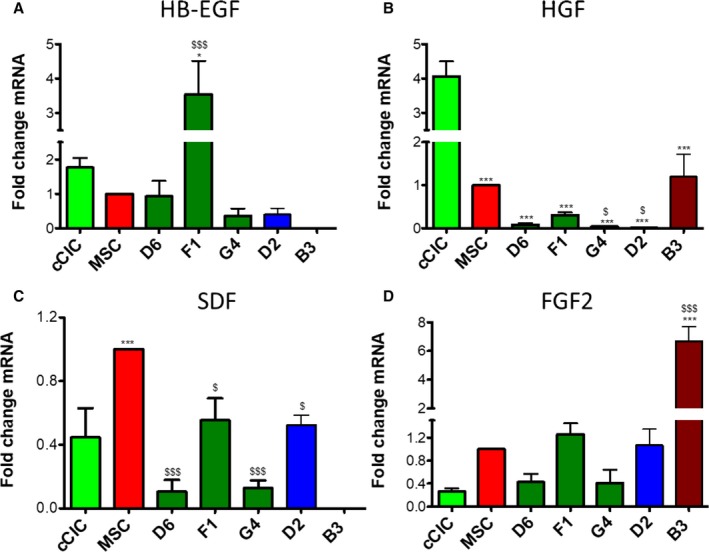
Figure 5.

Human CardioChimeras exhibit variable secretory gene profiles. mRNA expression level of (A) HB‐EGF (heparin‐binding epidermal growth factor–like growth factor), (B) HGF (hepatocyte growth factor), (C) SDF (stromal‐derived factor), and (D) FGF2 (fibroblast growth factor 2). N=3 independent experiments, 3 replicates (wells) per group per experiment. All genes expression is normalized to ribosomal 18s and represented as a fold change relative to mesenchymal stem cells (MSCs). Statistical analysis was performed by 1‐way ANOVA multiple comparison with Dunnett. *P<0.05 vs c‐kit+ cardiac interstitial cell (cCIC), **P<0.001 vs cCIC, ***P<0.0001 vs cCIC, $ P<0.05 vs MSC, $$ P<0.001 vs MSC, $$$ P<0.0001 vs MSC. Error bars are ±SEM.
