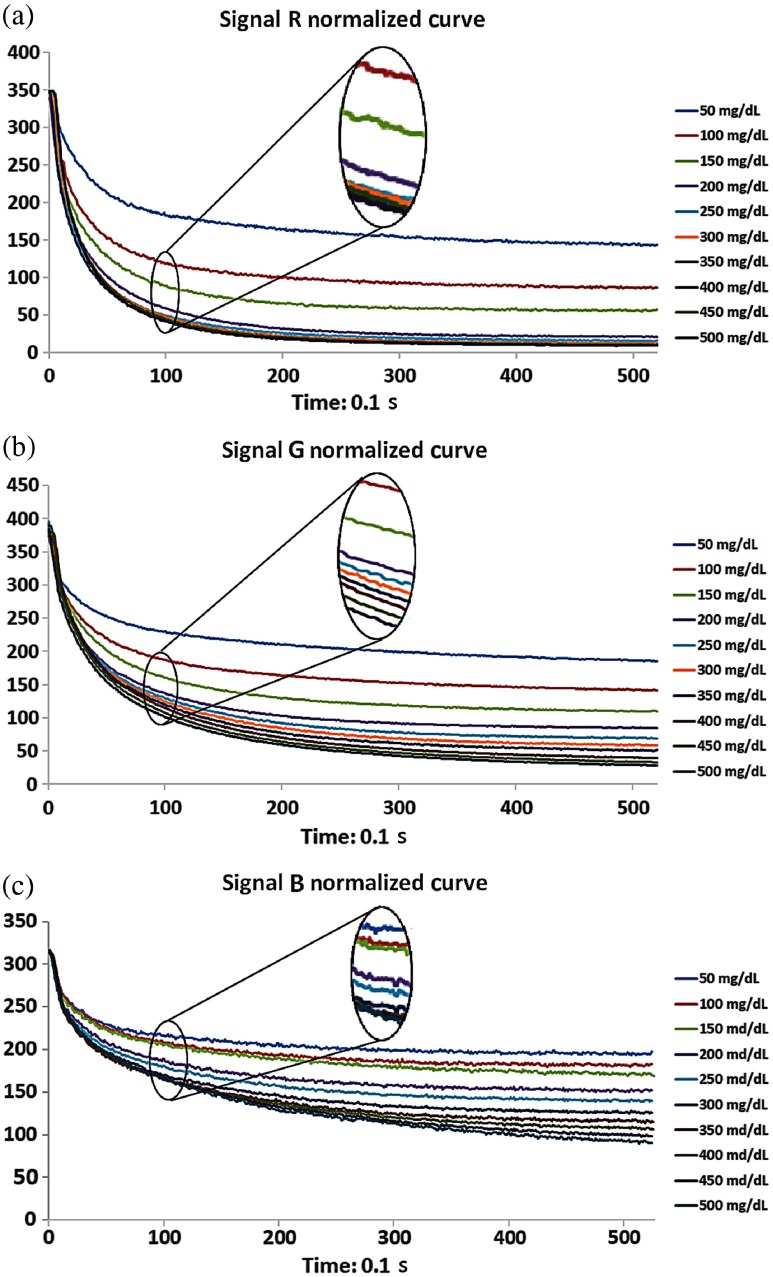
Fig. 4.
Normalized curve from the measurement of 10 different concentration blood samples over 50 s. Each curve represents the average of three measurements. (a) The R signal cannot be distinguished when the concentration reaches over 300 mg/dL. (b) The 10 different concentration curves of the G signal can be clearly separated after 10 s. (c) More than 30 s is required to distinguish the concentration curves of the B signal.

