
Figure 2.
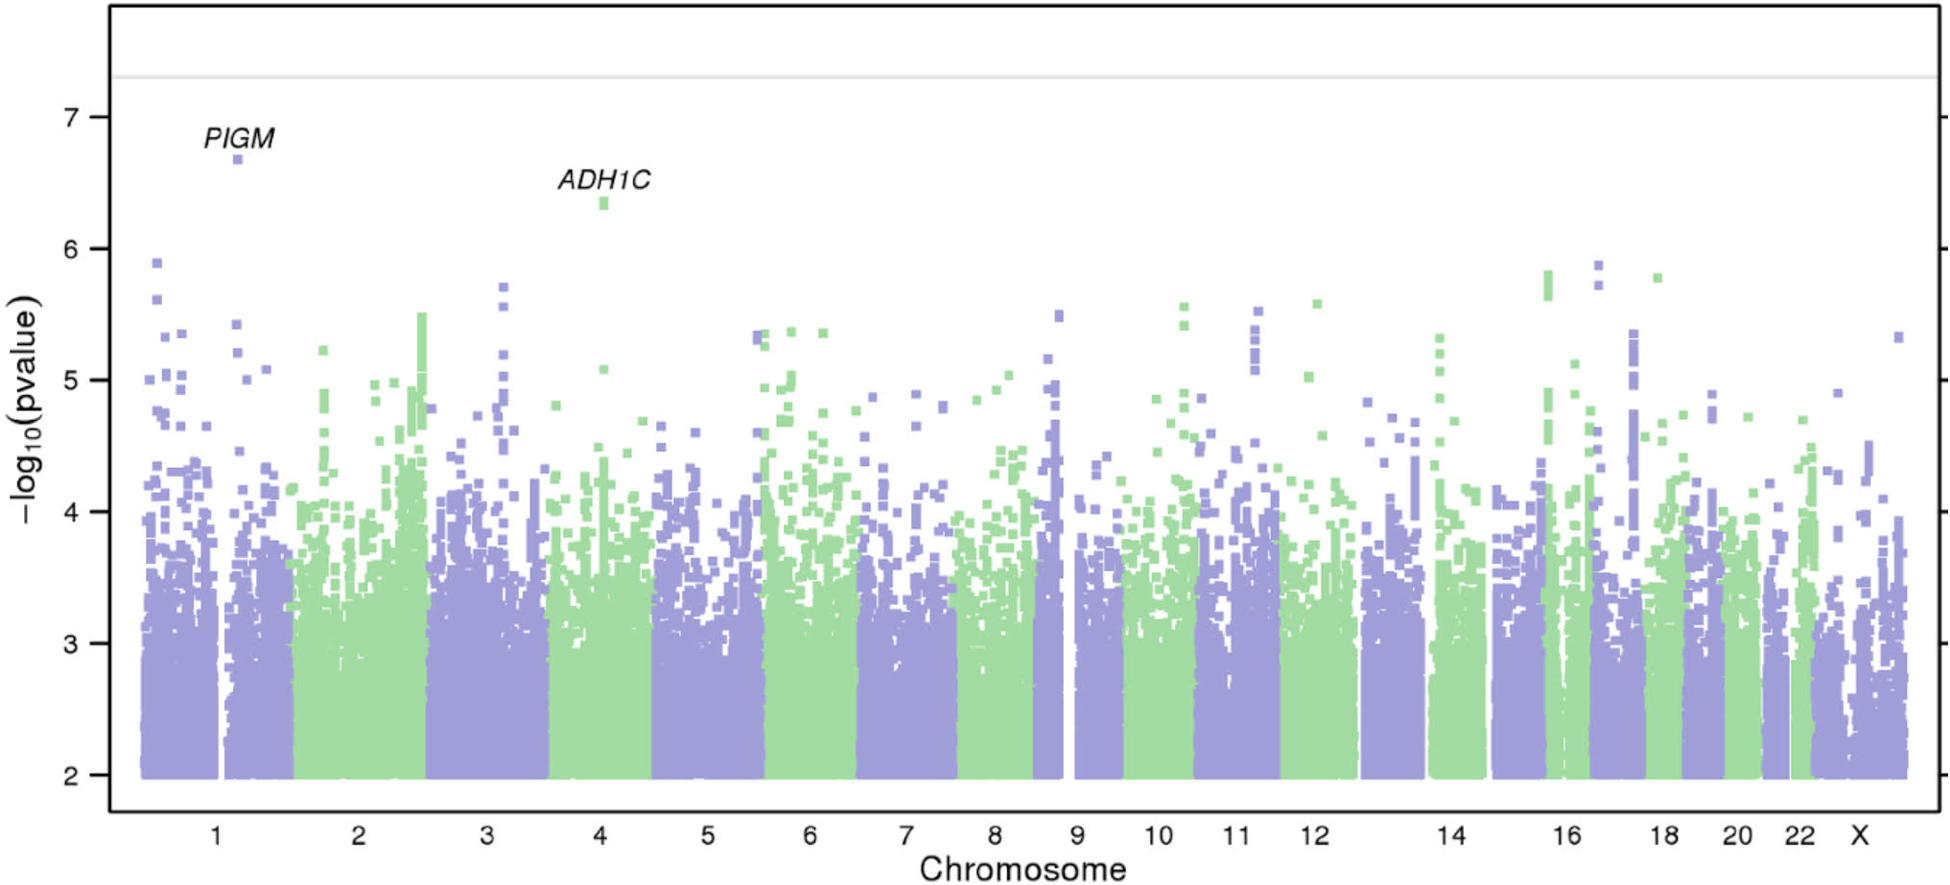
Results of GWAS on AUDIT. (a) Manhattan plot of GWAS results indicating the strongest associations between the 22 autosomes, X chromosome, and AUDIT. Line denotes genome-wide significance (P < 5 × 10⁻⁸).
Official websites use .gov
A
.gov website belongs to an official
government organization in the United States.
Secure .gov websites use HTTPS
A lock (
) or https:// means you've safely
connected to the .gov website. Share sensitive
information only on official, secure websites.
Results of GWAS on AUDIT. (a) Manhattan plot of GWAS results indicating the strongest associations between the 22 autosomes, X chromosome, and AUDIT. Line denotes genome-wide significance (P < 5 × 10⁻⁸).