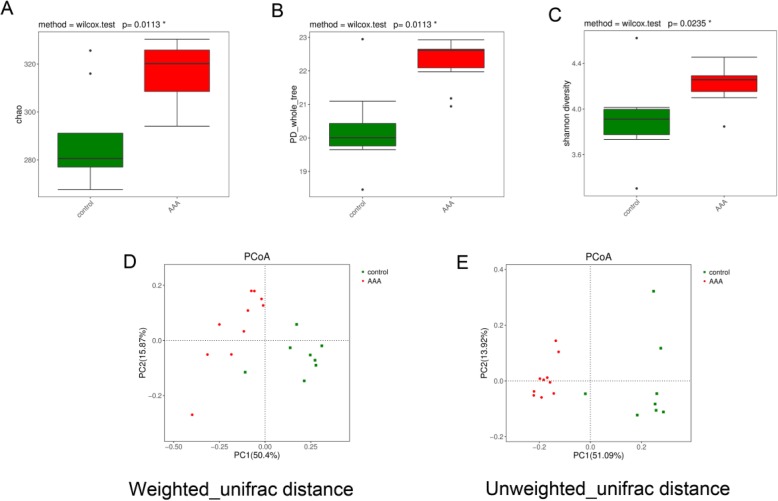
Fig. 3.
Alpha diversity of the a Chao index, b PD_whole tree and c Shannon index between the control and AAA groups. Principal coordinate analysis (PCoA) of gut microbiota for d Weighted_unifrac distance and e Unweighted_unifrac distance from AAA mice and control mice. (Red dots, AAA group; Green dots, control group)

