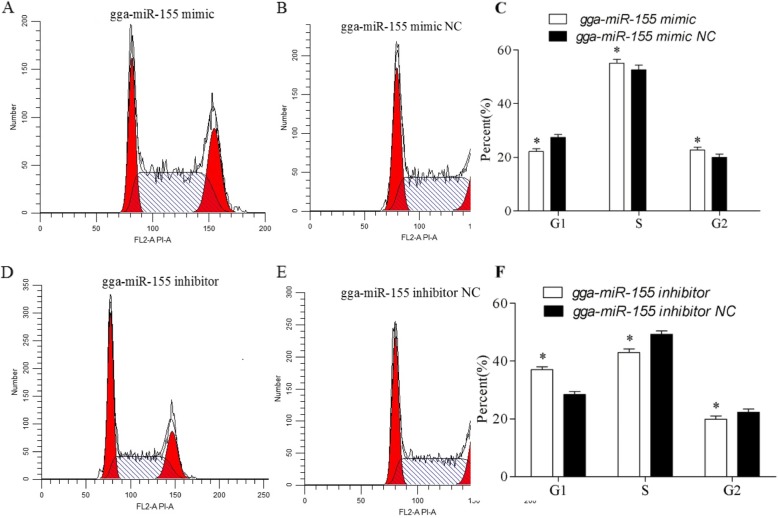
Fig. 3.
gga-miR-155 accelerated progression through the cell cycle. Flow cytometry histograms show the proportion of cells in the different phases of the cell cycle following transfection with (a) gga-miR-155 mimic, (b) gga-miR-155 mimic NC, (d) gga-miR-155 inhibitor and (e) gga-miR-155 inhibitor NC. Bar graphs comparing the percentage of cells in the G1, S and G2 phases of the (c) gga-miR-155 mimic/NC and (d) gga-miR-155 inhibitor/NC transfected groups.* P <0.05

