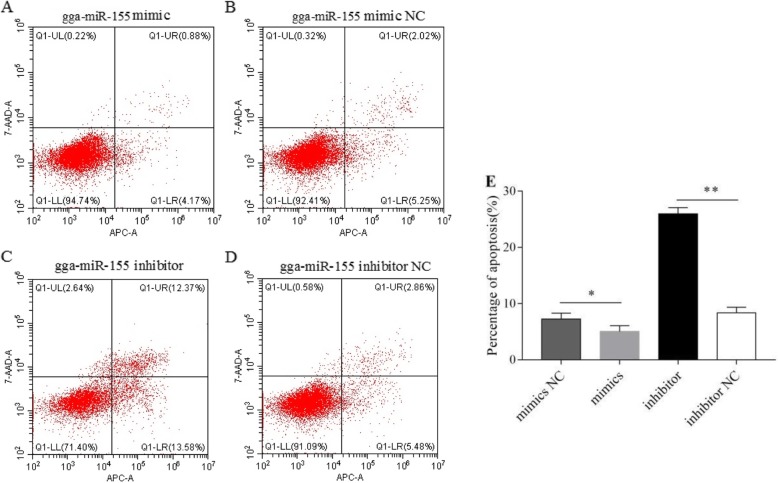
Fig. 4.
gga-miR-155 blocked apoptosis in MSB1 cells. Flow cytometry dot plots showing the percentage of live and apoptotic cells in the (a) gga-miR-155 mimic, (b) gga-miR-155 mimic NC, (c) gga-miR-155 inhibitor and (d) gga-miR-155 inhibitor NC groups. (e) Percentage of apoptotic cells in the different groups. * P <0.05

