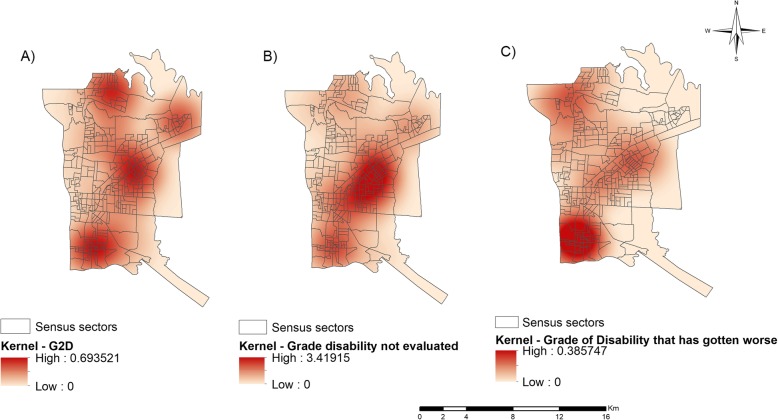
Fig. 5.
Spatial analysis of the leprosy disabilities in the Paraguay, Argentina and Brazil border region (2003–2015). a Density of leprosy cases with grade 2 disability at diagnosis, b Density of cases of leprosy in which the grade of disability was not reported/investigated at the time of diagnosis, c Density of leprosy cases in which there was worsening of the disability condition. Source: Created by the main author

