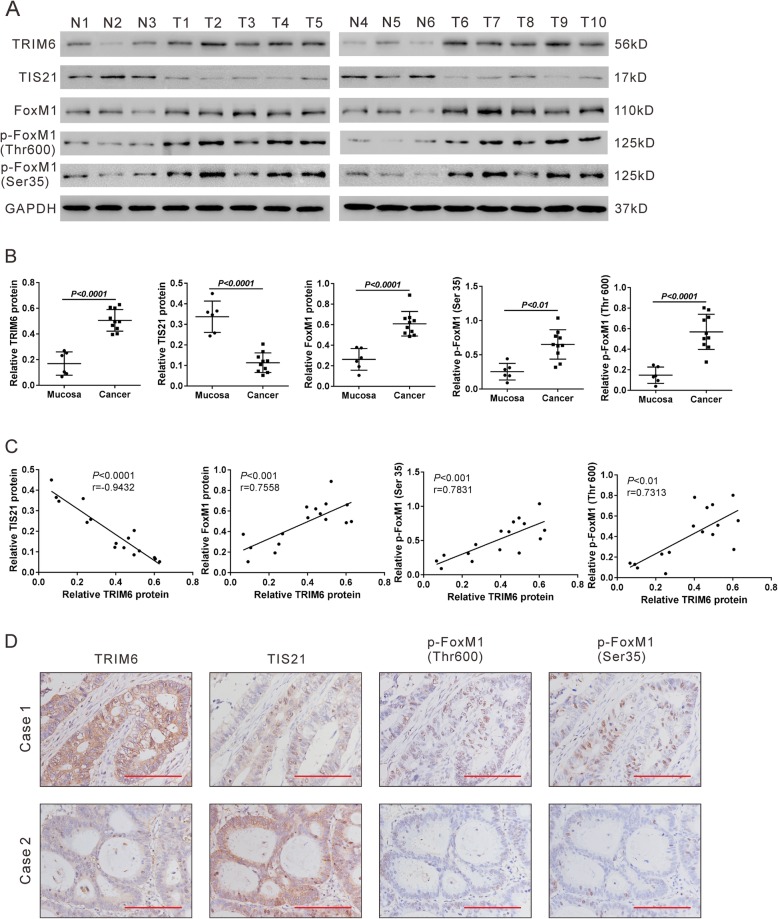
Fig. 8.
Correlation analyses in colorectal tissues. a, Western blotting analysis of TRIM6, TIS21, FoxM1, p-FoxM1 (Thr 600) and p-FoxM1 (Ser 35) in 6 normal mucosa samples and 10 CRC samples. b, Quantification of the western blotting data. c, Pearson correlation scatter plots in colorectal tissues. d, Representative images of IHC staining of TRIM6, TIS21, p-FoxM1 (Thr 600) and p-FoxM1 (Ser 35) in CRC samples (Case 1 and Case 2). Scale bar: 100 μm

