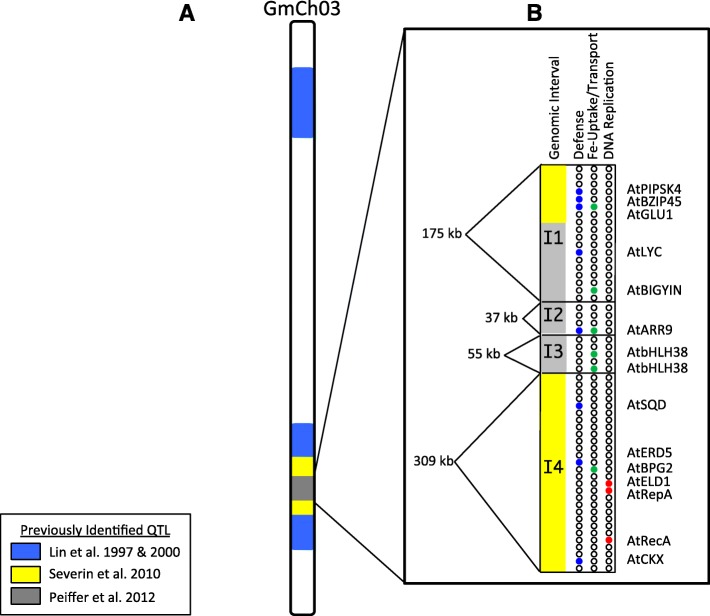
Fig. 3.
Deconstructing the IDC QTL on soybean chromosome 3 (Gm03) reveals multiple genes provide IDC tolerance. a) Lin et al. (Lin et al., 1997; Lin et al., 2000) identified a major QTL on Gm03 responsible for > 70% phenotypic variation in IDC tolerance (shown in blue). Severin et al. (Severin et al., 2010); identified the introgressed region (shown yellow). Peiffer et al. (Peiffer et al., 2012) used fine mapping of sub-NILs to further fine map the QTL (shown in grey). b Linkage disequilibrium analysis of the 57 SNPs spanning a 730 kb within the original Lin et al. (Lin et al., 1997) QTL divided this region into four distinct genomic intervals (I1, I2, I3, and I4). Each interval contains high priority candidate genes of interest (I1 = 5 genes; I2 = 1gene, I3 = 2 genes, I4 = 7 genes) that may be involved in conferring Fe deficiency tolerance either through iron-stress responsive (pink), enhanced defense (blue), Fe uptake/transport (green), or altered DNA replication (red). Additional details on this region are provided in Additional file 8)

