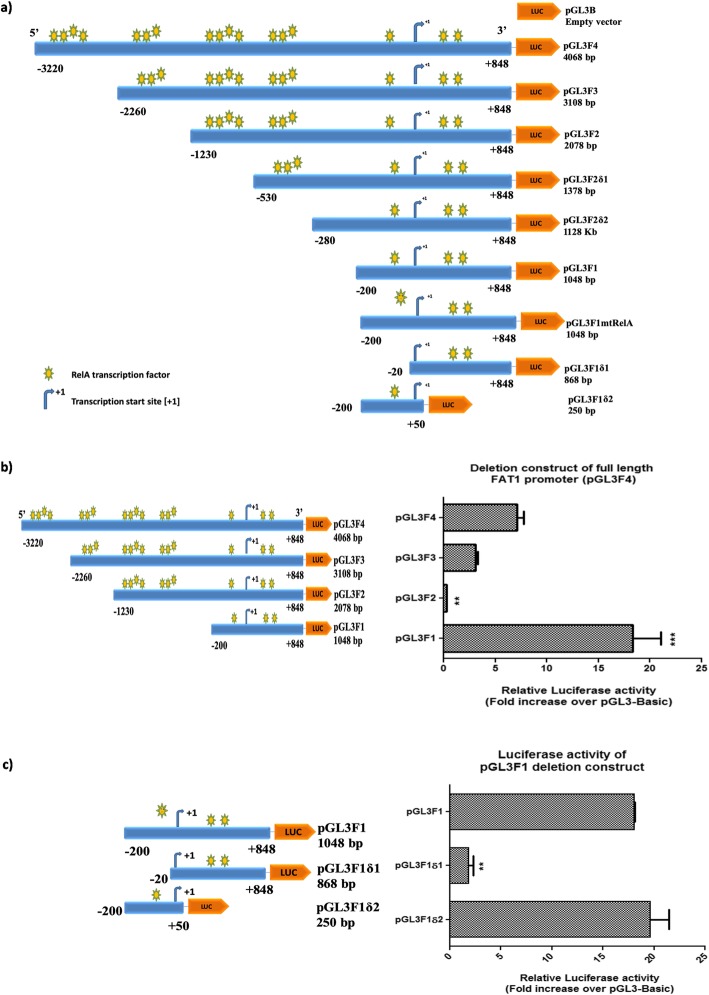
Fig. 4.
a A schematic diagram of FAT1 promoter constructs. 5′ and 3′ deletion constructs were generated from 4.0 kb full length FAT1 promoter (− 3220/+ 848 bp). To amplify FAT1 promoter region (4.0 kb) primers were designed (using Primer 3 software) and 5′ flanked with restriction enzymes, MluI in forward primer and NheI in reverse primer. To amplify 5′ sequentially deleted FAT1 construct, forward primers were designed at the corresponding sites (at -2260 bp, − 1230 bp, − 530 bp, − 280 bp, − 200 bp, − 20 bp) of the respective FAT1 constructs [− 3220 bp/+ 848 bp w.r.t. TSS (+ 1)] while the reverse primer (R) (at + 848 bp) was constant. To amplify 3′ deletion FAT1 construct, reverse primer was designed at corresponding site (at + 50 bp) of respective FAT1 construct and forward primer (at -200 bp) was paired. The FAT1 promoter inserts (F4, F3, F2, F2δ1, F2δ2, F1, F1δ1 and F1δ2) display TSS (+ 1), size of insert, 5′ upstream and 3′ downstream region of FAT1 promoter and yellow-green stars showing binding sites of NFkB (RelA) on each construct. b Luciferase activity of 5′ deletion constructs (pGL3F3, pGL3F2 and pGL3F1) of FAT1 promoter (pGL3F4). U87MG cells were transfected with pGL3F4 (4.0 kb) and its 5’deletion constructs [pGL3F3 (3.1 kb), pGL3F2 (2.0 kb) and pGL3F1 (1.0 kb)] for 48 h followed by dual luciferase assay. pGL3F1 showed the highest luciferase activity followed by pGL3F4, pGL3F3 and pGL3F2 as compared to pGL3B. c Luciferase activity of 5′ and 3′ deletion constructs of FAT1 promoter construct (pGL3F1): FAT1 promoter constructs [pGL3F1δ1 (0.86 kb) and pGL3F1δ2 (0.25 kb)] and pGL3F1 were transfected in U87MG; and luciferase activity was analyzed after 48 h. A comparable luciferase activity was observed in pGL3F1 and pGL3F1δ2. A significant decrease in the luciferase activity was observed in pGL3F1δ1 (4.43 fold ±0.61) as compared to pGL3F1. Bar graph represents fold luciferase activity of FAT1 promoter constructs (normalized to pGL3Basic and internal control pRLTK). Values are mean ± SE of at least three independent experiments performed in triplicates. Statistical analysis was performed using a paired two-tailed Student’s t-test. P-value < 0.05 was taken as significant (*p < 0.05, **p < 0.01, ***p < 0.001). Generated constructs were cloned and confirmed by sequencing and BLAST analysis

