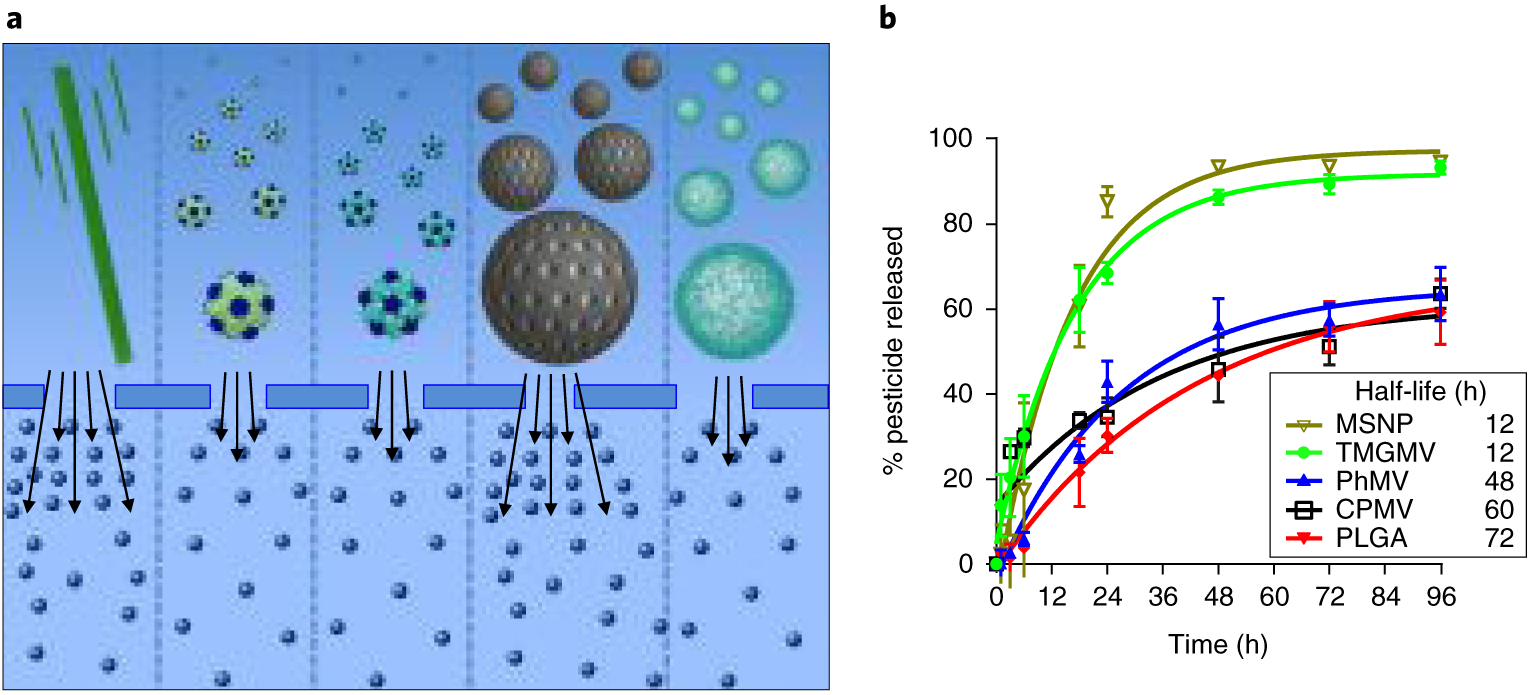
Fig. 2 |. Cargo release from nanoparticles during dialysis.

a, Schematic representation of the infused-dye release from (left to right) TMGMV, CPMV, PhMV, MSNP and PLGA. The dialysis membrane pores are large enough to allow the free movement of Cy5, but small enough to prevent nanoparticle diffusion. The number of arrows reflects the rate of dye release from each nanoparticle in a semi-quantitative manner. b, Corresponding plot of Cy5 cumulative release from each nanoparticle as a function of time. Error bars represent the s.d.
