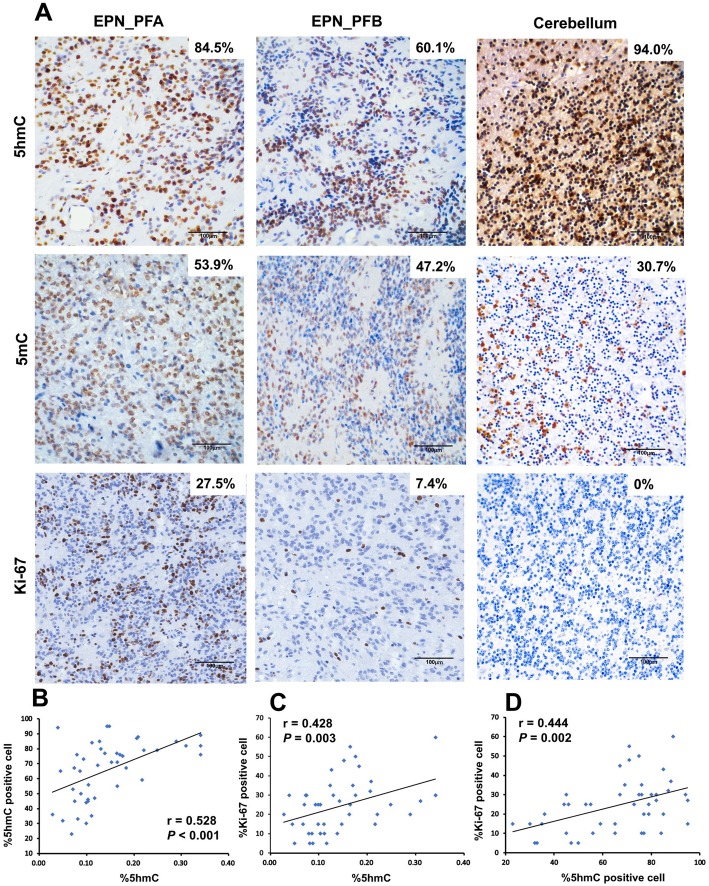
Fig. 2.
5hmC, 5mC, and Ki-67 index IHC staining in EPN_PF samples and normal cerebellum. a Representative image of 5hmC, 5mC, and Ki-67 staining in EPN_PF and cerebellum. b The Pearson correlation between nuclear positive cells of 5hmC and global 5hmC levels. c The Pearson correlation between Ki-67 index cells and global 5hmC levels. d The Pearson correlation between Ki-67 index and nuclear positive cells of 5hmC. Scale bars represent 100 μm

