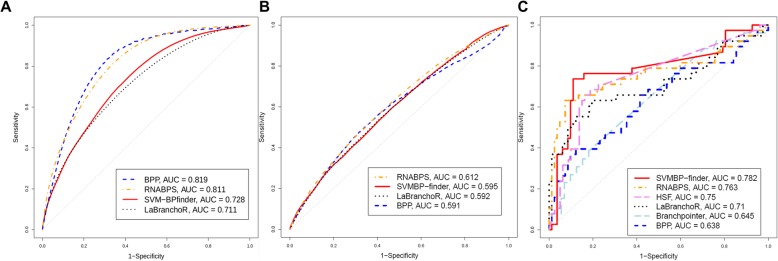
Fig. 2.
ROC curves of the bioinformatics scores. For each possible score threshold, sensitivity and specificity were plotted. a. The detection of branch points from the set of Ensembl acceptor splices sites (n = 114,868,082) of BPP, SVM-BPfinder, LaBranchoR and RNABPS scores. b. The detection of branch points from the alternative 3’ss by the SVM-BPfinder, BPP and LaBranchoR (n = 103,972). c. The delta scores of HSF, SVM-BPfinder, BPP, Branchpointer, LaBranchoR and RNABPS to class variants (n = 120)

