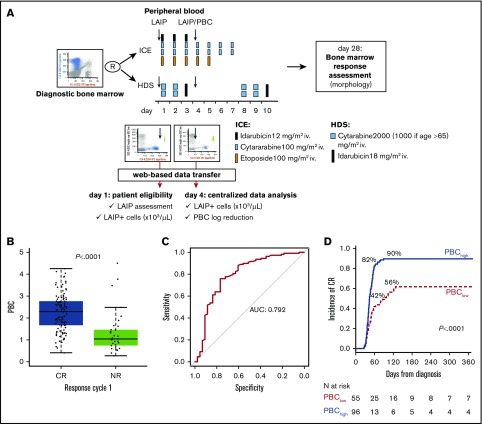
Figure 1.
Overall design of PBC study and correlation with response to induction. (A) Design of the study of PBC within NILG AML trial 02/06. The trial provided a randomization (R) between standard (ICE) and intensified (HDS) induction chemotherapy. Along treatment, on day 1 and day 4, cells bearing a previously identified aberrant immune-phenotype (LAIP) were quantified by multiparameter flow cytometry, and files were transmitted to the Coordinating Center for central analysis of data and PBC calculation. (B) Box plots show the distribution of PBC values according to response to first cycle. (C) ROC curve methodology allowed setting 1.5 logs as the best cutoff at separating patients with significantly different outcomes. For this threshold, the area under the curve (AUC) was 0.792. (D) Time to achievement of CR according to PBC category (<1.5 log or ≥1.5 log).

