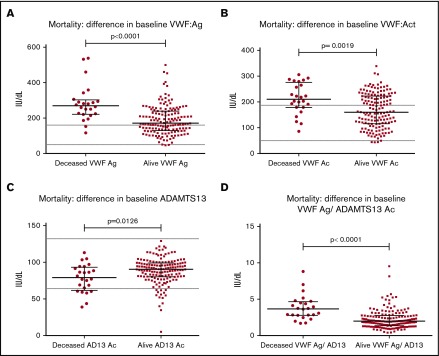
Figure 3.
Mortality outcome: difference in baseline hemostatic markers in IS and TIA groups combined. Significant differences were seen in all haemostatic markers at baseline between those patients whom had subsequently died at final follow up (n =2 4) vs those whom survived (n = 156) at a median follow up time of 152 days post initial presentation (minimum 6 weeks from first presentation). Differences were as follows (died vs survived): VWF:Ag (269.1 vs 171.2IU/dL, P < .0001) (A), VWF:Ac (210.5 vs 159.8IU/dL, P = .0019) (B), ADAMTS13 activity (79.1 vs 90.3IU/dL, P = .0126) (C), and mean VWF:Ag/ ADAMTS13Ac ratio (3.683 vs 1.988, P < .0001) (D).

