Figure 1.
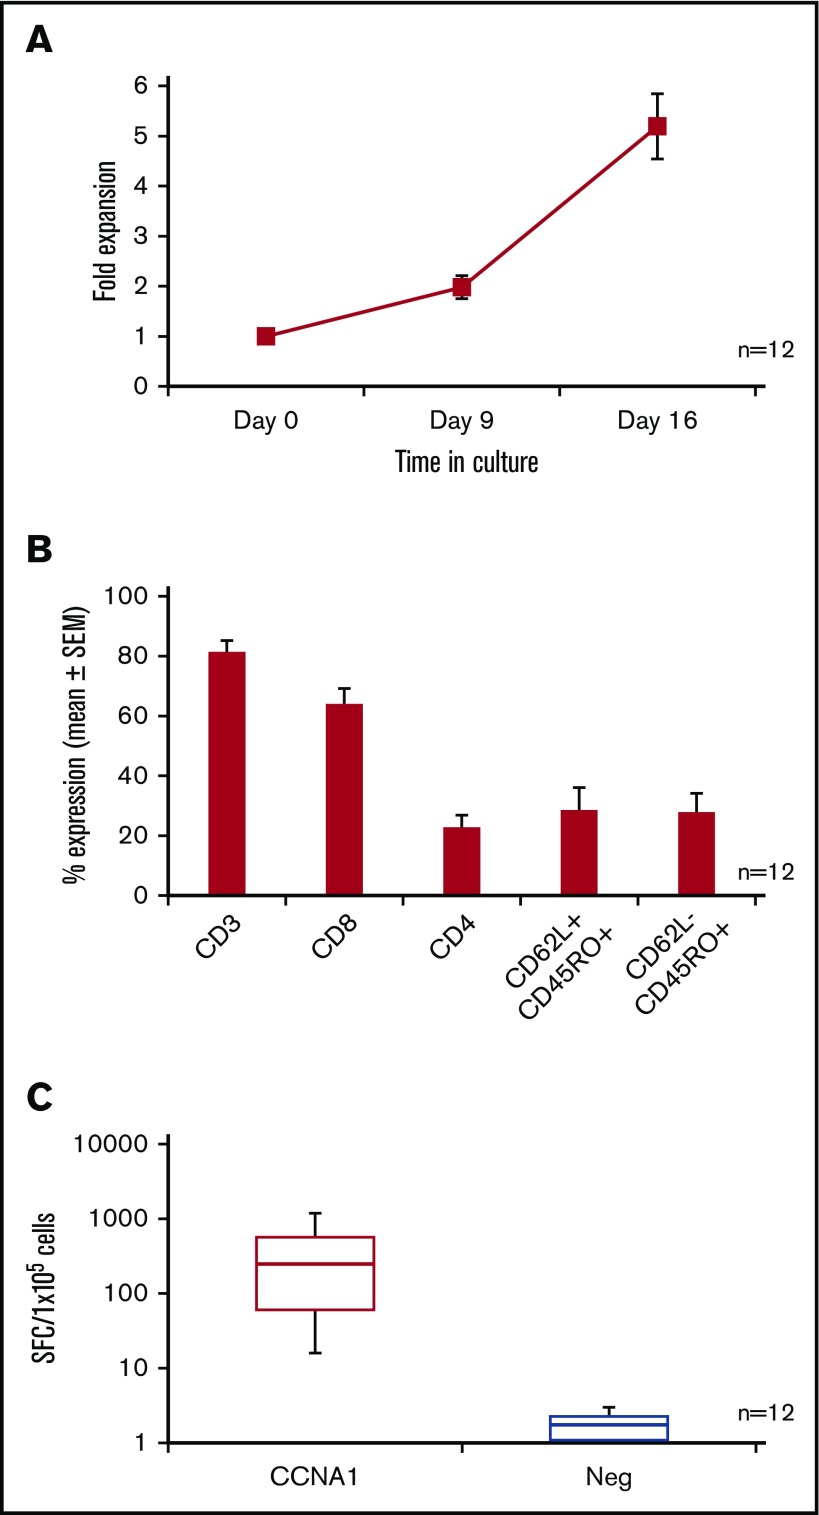
CCNA1-specific T-cell expansion and characterization. (A) Fold expansion of CCNA1-specific T cells (mean ± standard error of the mean [SEM]), based on cell counting using trypan blue exclusion (n = 12). (B) Immunophenotype of the expanded cell lines as assessed by flow cytometric analysis. (C) Specificity of expanded T cells as determined by IFN-γ ELISpot assay and data are presented as SFC/1 × 105 input cells. The whiskers of the plot indicate minimum and maximum values; boxes indicate median and interquartile ranges.

