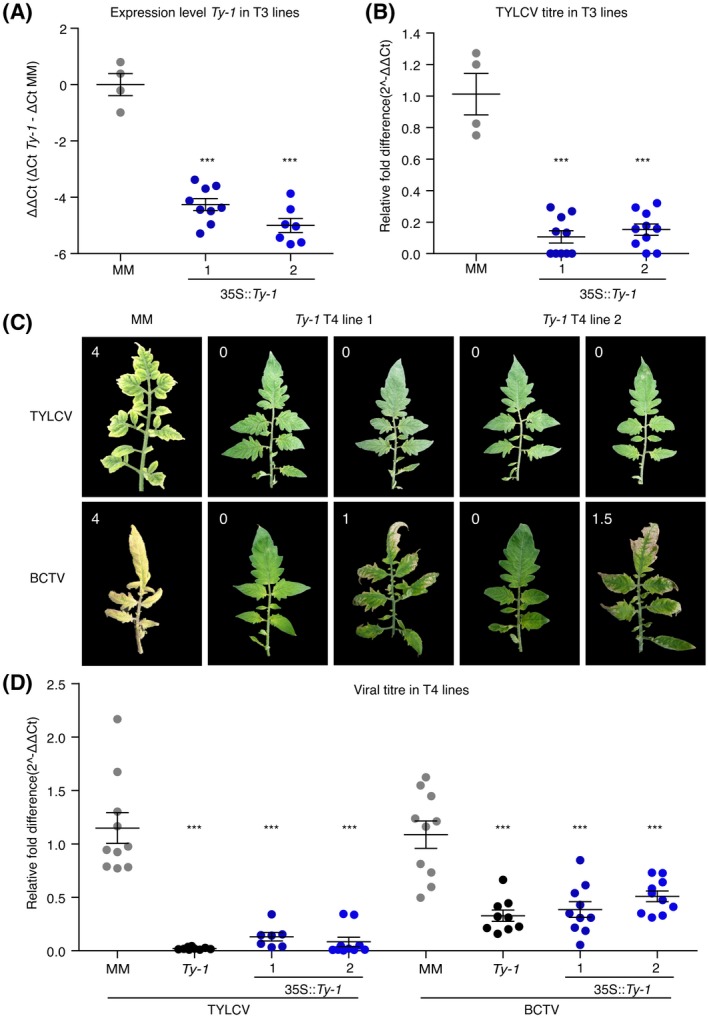
Figure 2.

Transgenic tomato plants expressing Ty‐1 are resistant against both BCTV and TYLCV. For resistant control (Ty‐1 introgression line) and susceptible control (Solanum lycopersicum 'Moneymaker', MM), five plants were included; ten plants of each transgenic line were tested. In all graphs lines represent means and standard error of the mean of biological replicates, dots represent individual plants. (A) Transcript levels of Ty‐1 in T3 families. Values were normalized relative to EF1α. The ΔΔC t values (ΔC t Ty‐1 (C t Ty‐1 – C t EF1α) − ΔC t MM (C t Ty‐1 – C t EF1α)) are depicted, which represent Ty‐1 expression relative to the level of the susceptible ty‐1 allele in untransformed MM plants. Asterisks indicate significant differences between T3 and untransformed MM plants according to one‐way analysis of variance (***P < 0.001). (B) Virus titre quantification in T3 progeny of Ty‐1 transformants. Values were normalized relative to EF1α and calibrated to the levels in untransformed MM plants, which were set to 1. Asterisks indicate significant differences between T3 and untransformed MM plants according to one‐way analysis of variance (***P < 0.001). (C) Symptoms on infection with mock‐inoculation, TYLCV and BCTV in MM and in different individuals of two T4 families of Ty‐1‐transformed tomato plants at 50 days post‐inoculation (dpi). In the upper left corners, the disease symptom scores are depicted. (D) Virus titre quantification in plants from two T4 families (35S::Ty‐1), a Ty‐1 introgression line and untransformed MM. Values are calibrated to tomato EF1α and the fold difference was calculated compared to (susceptible) MM plants inoculated with TYLCV or BCTV (set to 1). Asterisks represent significant differences to the TYLCV‐ or BCTV‐challenged MM samples according to one‐way analysis of variance (***P < 0.001).
