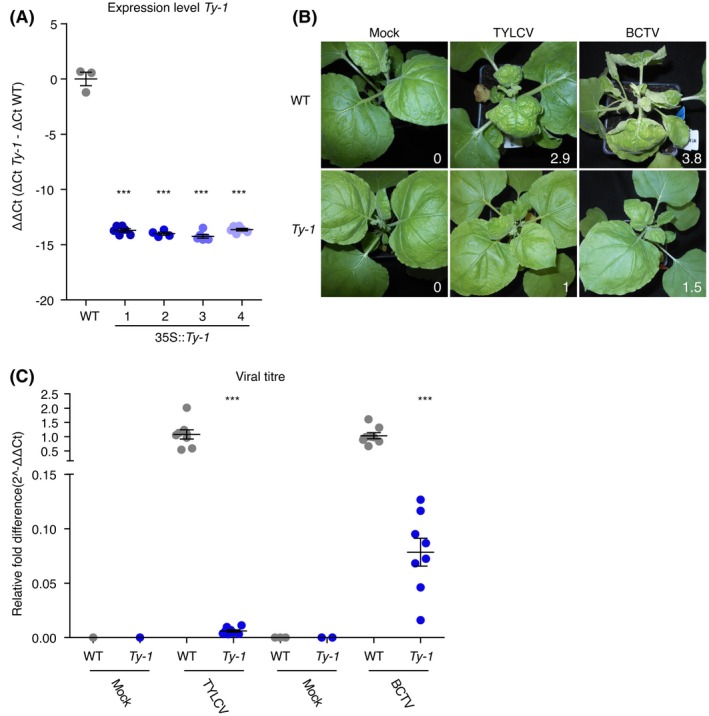
Figure 3.

Ty‐1 transgenic Nicotiana benthamiana plants are resistant to TYLCV and BCTV. In all graphs, every point represents one plant and lines represent means and standard error of the mean of biological replicates. (A) Four independent transformant lines were generated and the expression level of Ty‐1 was measured. Values were normalized relative to EF1α. The ΔΔC t values (ΔC t Ty‐1 (C t Ty‐1 – C t EF1α) − ΔC t WT (Ct Ty‐1 – C t EF1α)) are depicted, which represent Ty‐1 expression relative to wild‐type (WT) plants. Asterisks indicate significant differences between WT plants and Ty‐1 transformations according to one‐way analysis of variance (***P < 0.001). (B) Symptoms upon infection with mock‐inoculation, TYLCV or BCTV in WT and Ty‐1 transgenic N. benthamiana plants. Pictures were taken at 18 days post‐inoculation (dpi) and the symptom scores are depicted in the lower right corners. (C) Virus titre quantification in WT and Ty‐1 transgenic N. benthamiana plants upon challenge with BCTV or TYLCV. 18 days post‐BCTV/TYLCV infection, young uninoculated leaves were harvested. Total DNA was isolated and viral titres were measured compared to the presence of genomic DNA with primers amplifying the gene for 25S rRNA. The relative fold difference is depicted, which is calculated via the 2−ΔΔCt method (WT infected plants set to 1). Note that the y‐axis is split to show the low titres. Asterisks indicate significant differences between WT plants and Ty‐1 transformants according to one‐way analysis of variance (***P < 0.001).
