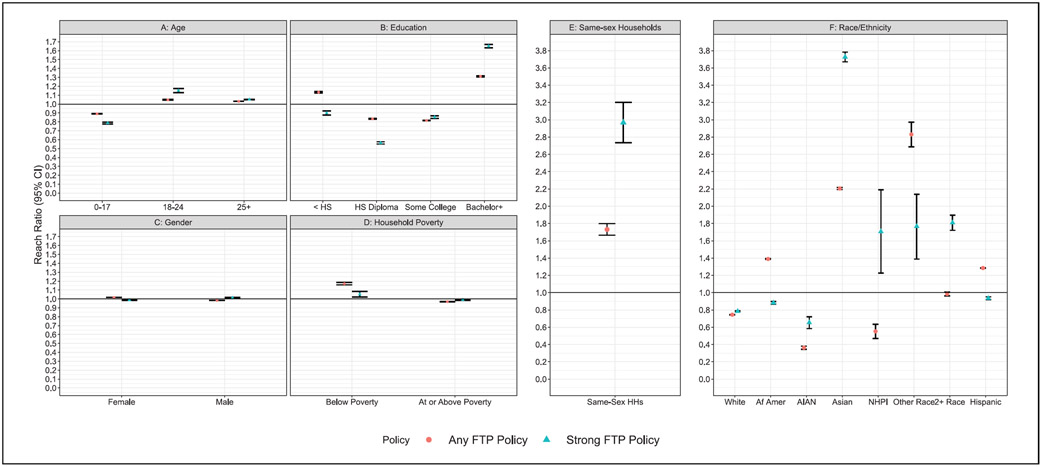
Figure 1. Forest Plots of Reach Ratios (ReRas) for Each Vulnerable Population by Any and Strong Flavored Tobacco Product (FTP) Policya,b.
a95% confidence interval (CI) >1 indicate greater reach equity of the policy to the group relative to its population proportion; 95% CI including 1 indicate equitable reach relative to population proportion and 95% CI <1 indicate lesser reach equity to the group relative to its population proportion. bHousehold poverty estimates are based on a denominator of the subset of the total population for whom poverty status was determined.

