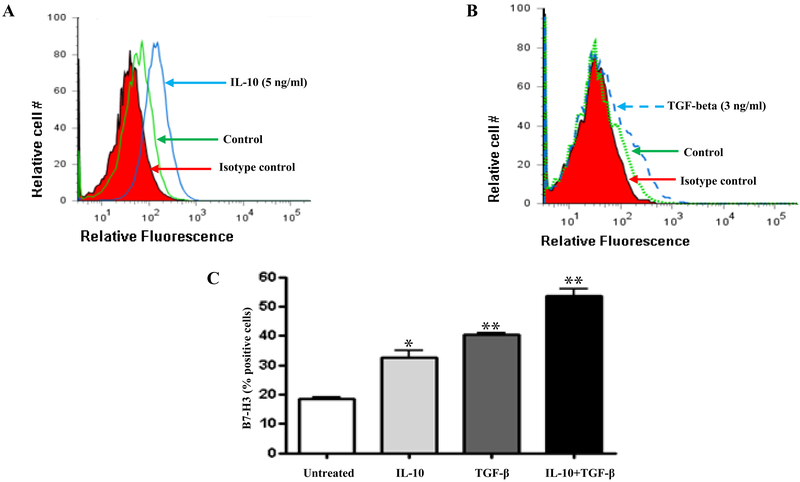
Figure 5.
B7-H3 expression is regulated by Treg cell cytokines. (A) Flow cytometry analysis of GEC cells stained for B7-H3 after exposure to 5 ng/mL IL-10 for 24 h showed increased expression in a representative histogram where the solid peak is the isotype control (B) Flow cytometry was done to measure B7-H3 expression on GECs after treating the cells with TGF-β (3 ng/ml) for 24 h. (C) Flow cytometry was done to measure B7-H3 expression on GECs treated with either IL-10 (5 ng/mL) or TGF-β (3 ng/ml) or both IL-10 and TGF-β. The data were expressed as the percentage of positive cells. The means ± SD are shown as the results of duplicates of one of four representative experiments: n=8, * P < 0.05, ** P < 0.01 and *** P < 0.001.

