
Figure 1.
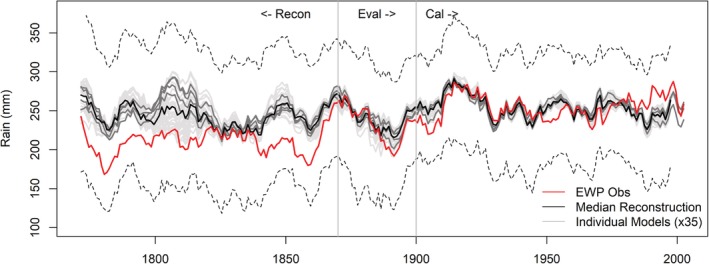
Decadal mean observed and modelled EWPw 1767–2002. Included are median simulations from each of the 35 individual models (grey lines) together with the ensemble median (black line). Dark grey lines represent models based on observed data only. Dashed lines indicate upper and lower 95% confidence intervals for reconstructions