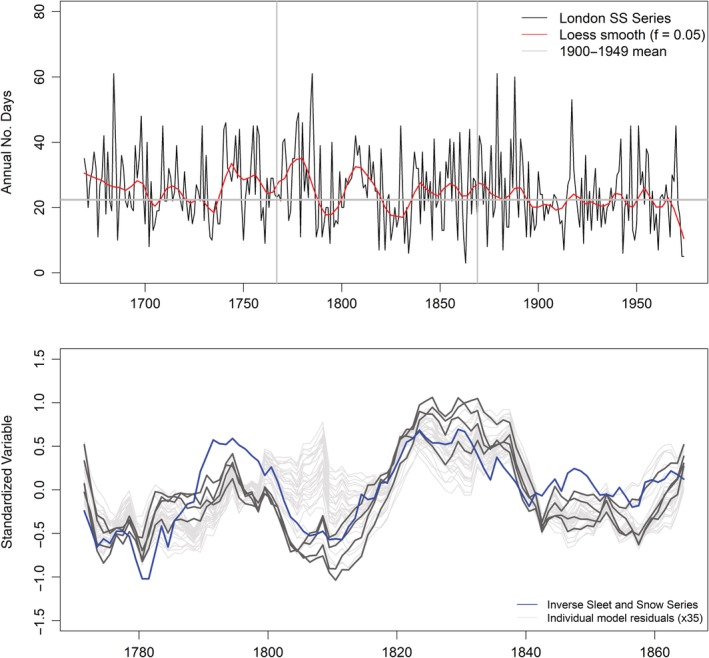
Figure 2.

(a) Manley's Sleet and Snow Series for the greater London area 1669–1974. Also plotted is the loess smoothed (f = 0.05) series. Vertical grey lines indicate years employed to investigate winter model residuals. (b) Comparison of standardized decadal mean inverse sleet and snow series (blue) 1767–1869 with standardized decadal mean model residuals. Grey lines represent median residuals from each model, dark grey lines are models based on observations only. Black line shows the ensemble median residual
