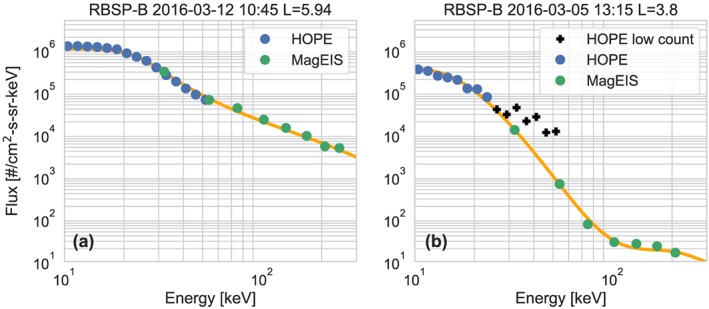
Figure 2.

(a and b) Examples of spectra in the HOPE‐MagEIS overlap region. The black crosses show HOPE data that were not included because the counts were too low (<125). The yellow line shows the fit combined flux spectra described in section 4. RBSP = Radiation Belt Storm Probes; HOPE = Helium Oxygen Proton Electron mass spectrometer; MagEIS = Magnetic Electron Ion Spectrometer.
