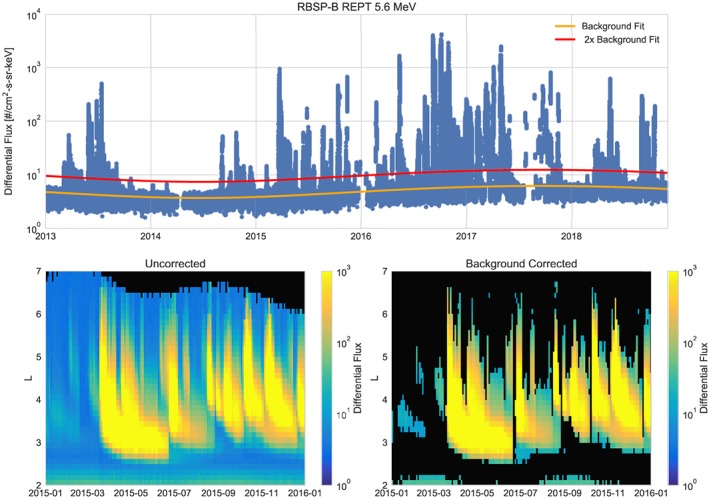
Figure 7.

Example of the background fit for the 5.6‐MeV channel on RBSP‐B. The top panel shows the data from near apogee (L>6) with the background fit (orange line) and 2 times the background fit shown in red. The bottom left panel shows an L‐sorted spectrogram of the uncorrected data; the bottom right show the data after the fit is applied. Points where the fluxes were below the background fit are shown in black. RBSP = Radiation Belt Storm Probes.
