
Figure 2.
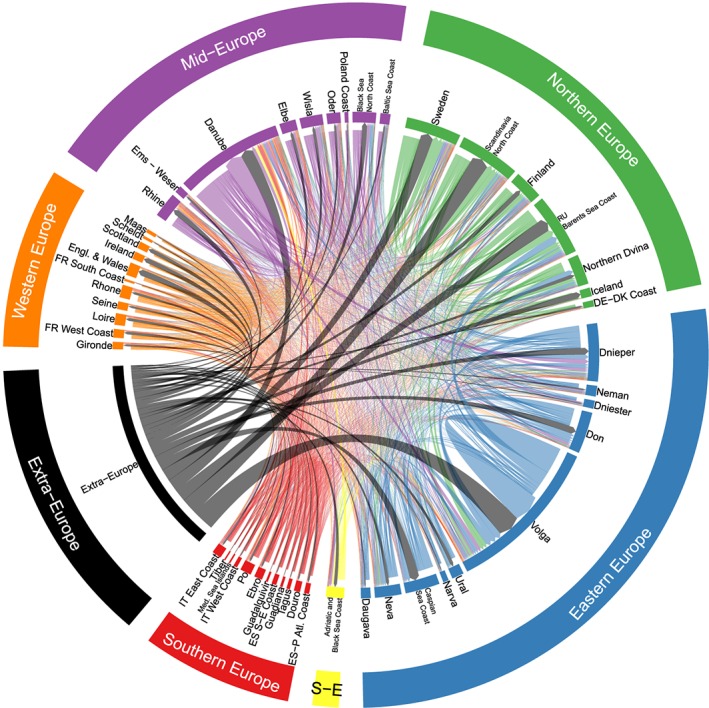
Climatological chord diagram visualizing the watershed precipitation recycling network for the 50 major European watersheds during summertime (1980–2016). Lines between watersheds illustrate the quantitative source‐sink relationships between evaporation [km3/summer] and precipitation [km3/summer], based on the ensemble mean. Colors represent the region of the source watershed. Flows are illustrated from the evaporating watershed (represented by a gap between the watershed bar and flow line) to the precipitating watershed (represented by an arrow toward the watershed bar). For better illustration, contributions below the 0.1 quantile of all contributions are not represented.